Introduction: The Sovereign Wealth Parallel
When Norway discovered oil in the North Sea, the government faced a profound question: how do you invest the proceeds of a finite resource without creating dependence on that same resource? The answer became the Government Pension Fund Global, now managing over $2 trillion with a mandate that explicitly excludes oil and gas companies from significant portions of its portfolio.
The logic is elegant and often overlooked. Norway's economic fate is already tied to petroleum. Every Norwegian citizen's prosperity rises and falls with energy prices. To invest the national savings fund heavily in oil equities would be to double down on an exposure that already dominates the national balance sheet.
Family offices face an identical challenge, yet most construct portfolios as if their wealth appeared from nowhere.
Consider a family office funded by a luxury goods conglomerate still paying substantial dividends. The family's economic exposure to consumer discretionary spending, European economic health, and high-net-worth purchasing behavior is already overwhelming. A "diversified" portfolio of 60% global equities and 40% bonds does nothing to address this concentration. In fact, it likely amplifies it, since global equity indices are heavily weighted toward the same consumer and luxury dynamics that drive the family's primary wealth.
This is not diversification. It is correlation blindness.
Key Takeaways
- First principles exposure: Your family office portfolio must account for the correlation between your primary wealth source and your investment allocations
- 42% alternatives allocation: Leading family offices now hold an average 42% in alternatives, up from 35% five years ago
- Geographic alpha: Emerging market alternatives offer 200-400 basis points of premium over developed market equivalents with proper manager selection
- The 50/30/20 evolution: Forward-thinking allocators are moving toward 50% equities, 30% bonds, 20% alternatives as a baseline, with alternatives themselves diversified by geography
- Sovereign wisdom: Apply the same logic that guides over $10 trillion in sovereign wealth globally: diversify away from your existing economic exposures, not toward them
The 60/40 Autopsy: What Broke and Why
The year 2022 delivered the worst performance for a 60/40 portfolio since 1937. Stocks fell 18%. Bonds fell 13%. The supposed hedge failed precisely when hedging mattered most.
But 2022 was not an anomaly. It was a revelation. The negative correlation between stocks and bonds that made 60/40 work for four decades was itself an artifact of a specific macroeconomic regime: declining inflation and falling interest rates. When that regime ended, so did the free lunch.
Historical 60/40 Performance by Regime
| Period | Inflation Regime | Stock-Bond Correlation | 60/40 Annualized Return |
|---|---|---|---|
| 1980-2000 | Declining (14% to 3%) | Strongly Negative | 12.8% |
| 2000-2020 | Low and Stable (2-3%) | Negative | 7.2% |
| 2020-2024 | Rising then Volatile (1% to 9% to 3%) | Positive | 4.1% |
Source: Morgan Stanley Investment Management, Bloomberg, Federal Reserve data. 2022 60/40 return of -17.5% confirmed as worst since 1937.
The data reveals an uncomfortable truth: when inflation exceeds 3%, stock-bond correlation historically turns positive. Bonds stop hedging equity risk and start amplifying it. For families with multi-generational time horizons, building portfolios on regime-dependent assumptions is not conservative. It is reckless.
The Correlation Shift
The mechanism is straightforward. In a low-inflation world, economic weakness triggers both falling stock prices and falling interest rates. Bonds rally when stocks fall. But in an inflationary world, economic weakness does not guarantee falling rates. Central banks may maintain restrictive policy to fight inflation even as growth deteriorates. Stocks and bonds fall together.
For family offices, the implication is clear: bonds alone cannot provide the diversification that genuine wealth preservation requires. You need assets whose return drivers are fundamentally different from both stocks and bonds.
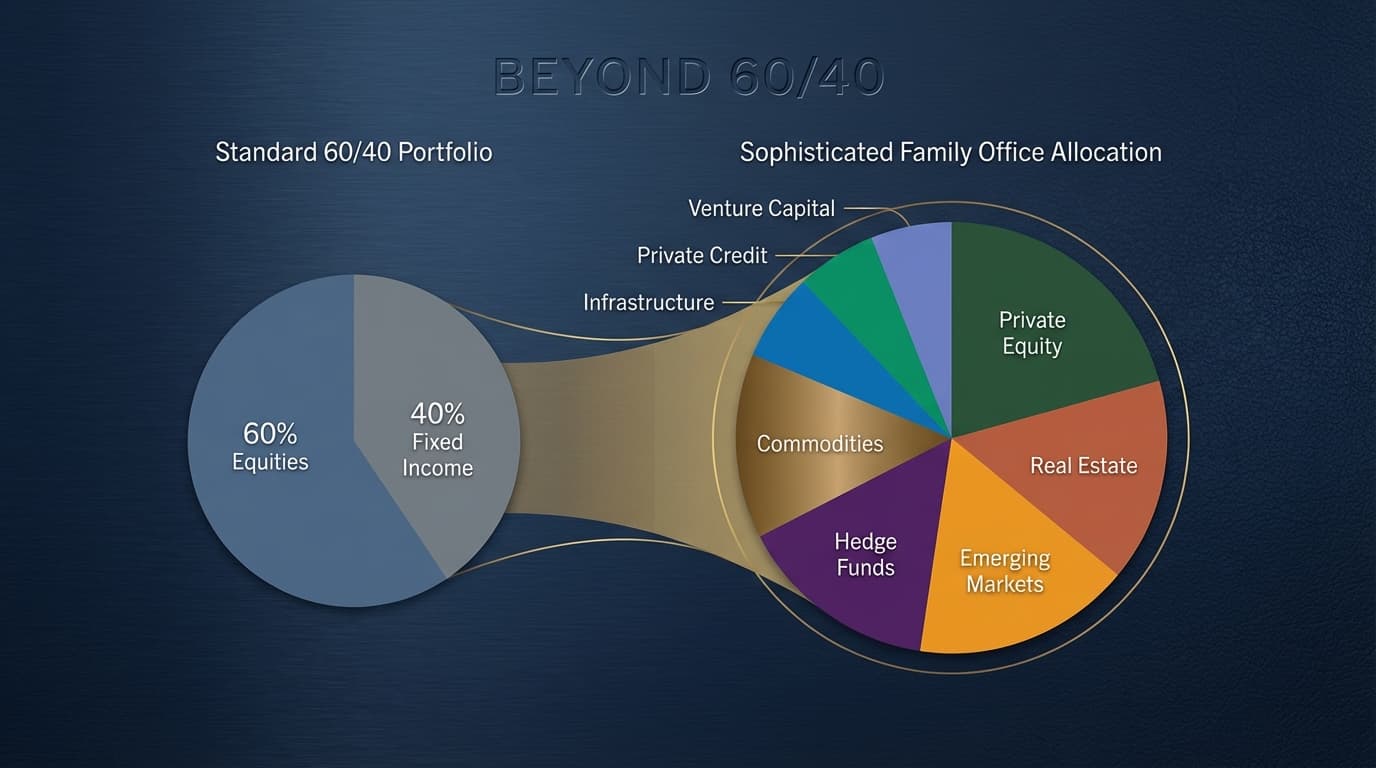
The Family Office Allocation Revolution
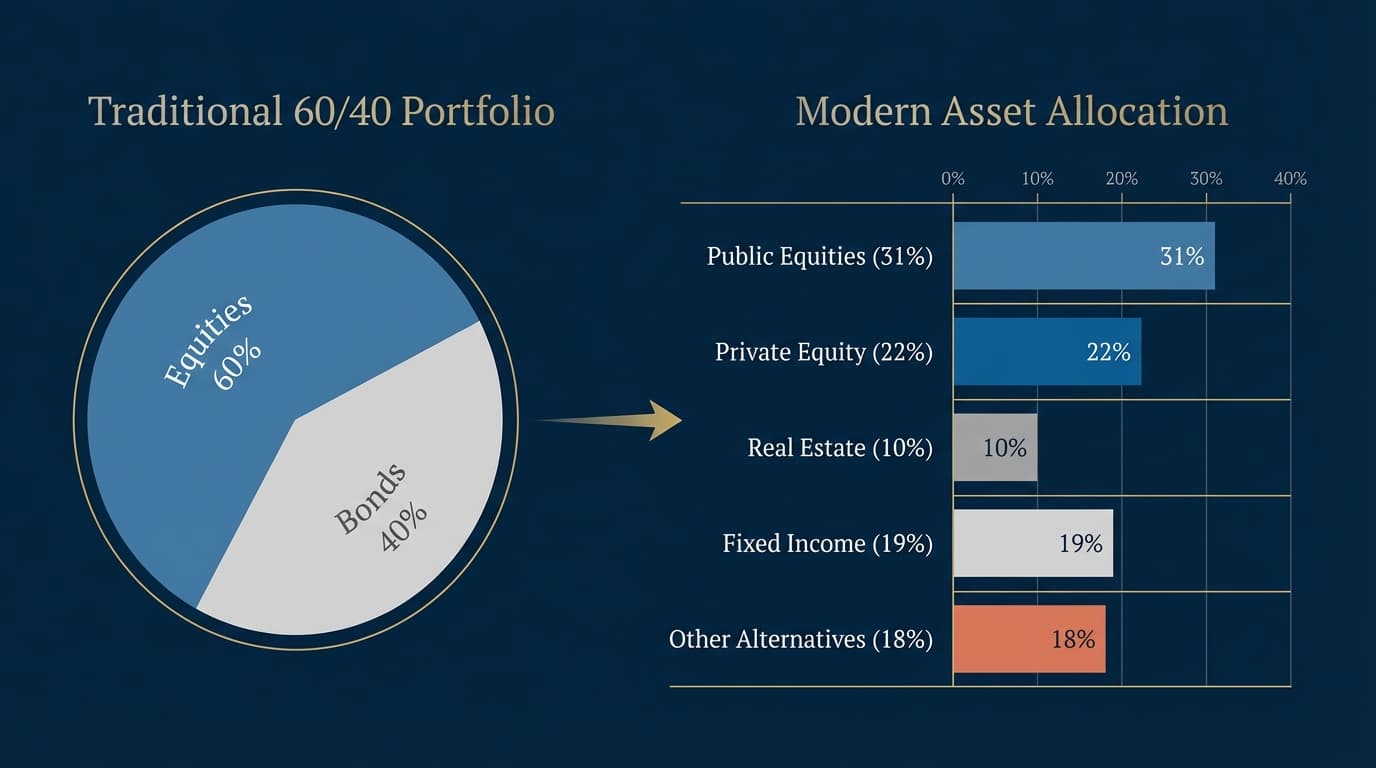
The most sophisticated family offices have already moved. According to Goldman Sachs' 2025 Family Office Report, the average family office now allocates 42% to alternative investments, up from 35% in 2020. Public equities account for 31%, with fixed income comprising most of the remainder.
Current Family Office Allocation (2025 Average)
| Asset Class | Average Allocation | Change vs. 2020 |
|---|---|---|
| Alternatives (Total) | 42% | +7% |
| - Private Equity | 22% | +4% |
| - Real Estate | 10% | +1% |
| - Hedge Funds | 6% | -2% |
| - Private Credit | 4% | +4% |
| Public Equities | 31% | -3% |
| Fixed Income | 19% | -5% |
| Cash and Equivalents | 8% | +1% |
Source: Goldman Sachs 2025 Family Office Investment Insights Report, "Adapting to the Terrain" (245 family office respondents)
But allocation percentages tell only part of the story. The more important question is: what drives those alternatives, and how do they correlate with your existing exposures?
The First Principles Allocation Framework
Before selecting any investment, a family office must answer three questions:
- What is our primary economic exposure through the operating business or wealth source?
- Which asset classes and geographies are correlated with that exposure?
- Where can we find genuine diversification that also offers attractive risk-adjusted returns?
For a family whose wealth derives from European luxury goods, this analysis might reveal:
- High correlation with European consumer spending
- Exposure to EUR currency fluctuations
- Sensitivity to Chinese high-net-worth consumer behavior
- Cyclical risk tied to global wealth effects
A truly diversified portfolio for this family would emphasize:
- USD and emerging market currency exposure
- Infrastructure and real assets with inflation linkage
- Healthcare and essential services with defensive characteristics
- Geographic allocation to markets with independent growth drivers
Operating Business Correlation Matrix
Different wealth sources create dramatically different hidden portfolio correlations:
| Wealth Source | High Correlation (Avoid) | Low Correlation (Favor) | Currency Bias |
|---|---|---|---|
| Technology (SaaS/Software) | NASDAQ, growth equities, USD bonds | Infrastructure, healthcare, commodities | Diversify from USD |
| Luxury Goods | Consumer discretionary, European equities | Utilities, EM staples, agriculture | Diversify from EUR |
| Real Estate (Commercial) | REITs, financials, rate-sensitive bonds | Technology, EM equities, private credit | Match liability currency |
| Energy/Commodities | Resource equities, EM currencies, inflation assets | Technology, healthcare, consumer staples | Already commodity-linked |
| Financial Services | Bank stocks, credit spreads, developed markets | Real assets, agriculture, frontier markets | Diversify from home currency |
| Healthcare/Pharma | Healthcare equities, defensive sectors | Cyclicals, infrastructure, EM growth | Typically USD-heavy already |
| Manufacturing/Industrial | Industrials, global trade proxies, EM suppliers | Healthcare, digital, consumer services | Trade-weighted exposure |
This matrix reveals why a "diversified" 60/40 portfolio fails most families. A technology founder holding 60% global equities has perhaps 35% technology exposure through index weights alone. Combined with their operating company stake, their true technology exposure may exceed 70% of total wealth. A market correction in technology would devastate both their operating business value and their "diversified" portfolio simultaneously.
This is what sovereign wealth funds do instinctively. Abu Dhabi Investment Authority does not invest its oil proceeds primarily in energy equities. It diversifies into infrastructure, real estate, and growth sectors in markets whose prosperity is not tied to petroleum.
Three Families, Three Strategies: Practical Applications
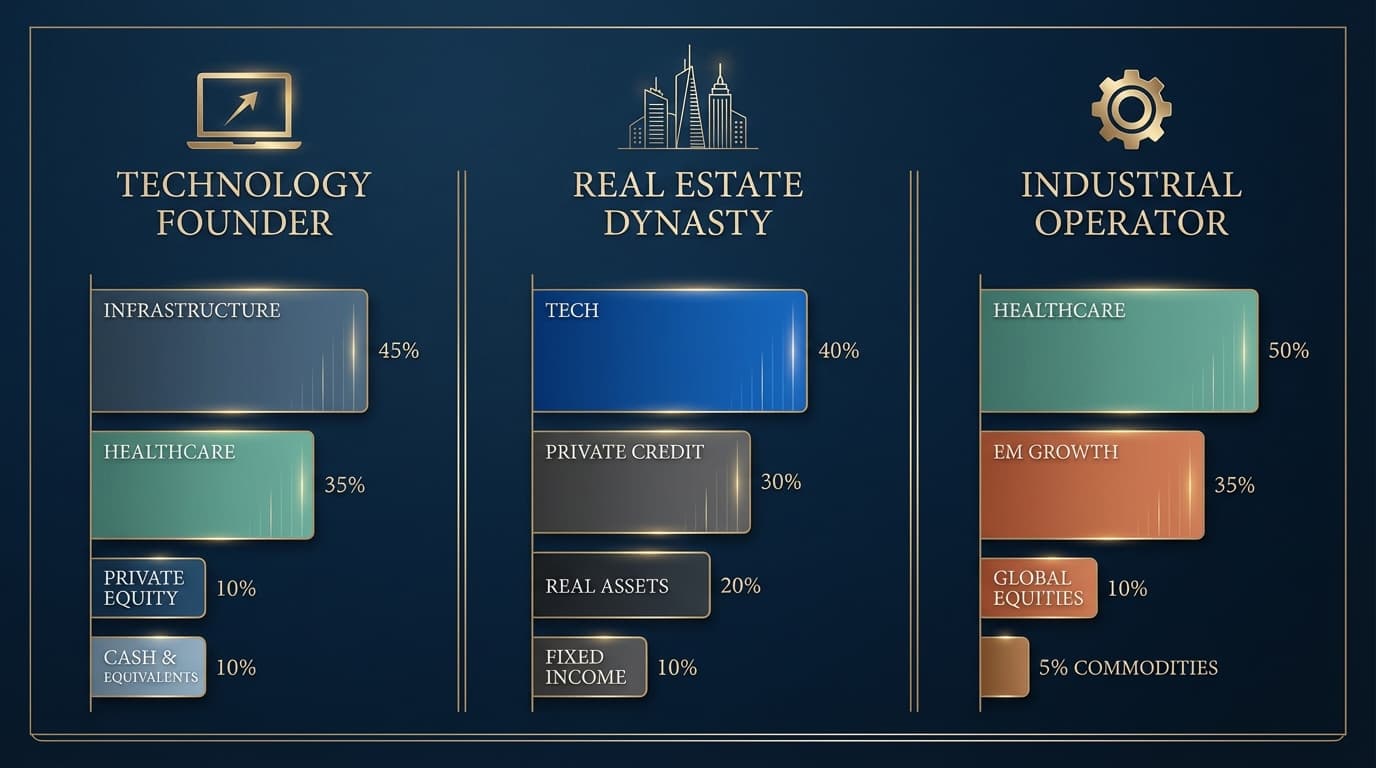
The Technology Founder: A family with $800 million in liquid wealth from a partial secondary sale, but still holding a $400 million stake in their enterprise software company, faces massive concentrated exposure to technology valuations, USD strength, and growth stock dynamics. Their remaining equity stake already represents 33% of total net worth tied to tech. If their "diversified" liquid portfolio holds 30%+ technology through index funds, their true tech exposure exceeds 50% of family wealth. True diversification means: infrastructure investments with regulated returns, healthcare and consumer staples exposure, emerging market real assets, and EUR/GBP currency diversification. They should actively underweight or eliminate technology exposure in their liquid portfolio to offset the concentrated position they cannot easily sell.
The Real Estate Dynasty: A family with $1.2 billion from commercial real estate holdings in major European cities already has substantial exposure to interest rates, European economic health, and physical asset valuations. Adding public REITs to their portfolio amplifies rather than diversifies risk. Their allocation should emphasize: technology and innovation investments (low correlation to physical assets), emerging market equities with different growth drivers, and private credit strategies that benefit from rising rates rather than suffering from them.
The Industrial Operator: A family still receiving dividends from a manufacturing business tied to global trade flows has implicit exposure to supply chains, industrial commodities, and developed market consumer spending. Their diversification strategy should target: healthcare and pharmaceutical investments (defensive and uncorrelated), digital infrastructure plays, and African/Southeast Asian consumer growth that operates independently of Western industrial cycles.
Beyond Allocation: The Geographic Alpha Opportunity
Here is where most family office discussions stop too early. Having decided to allocate to alternatives, the default is to invest with the largest, most established managers in developed markets. This is comfortable. It is also suboptimal.
The same first principles logic that demands diversification away from your primary exposure also demands consideration of where alternatives themselves are deployed. A venture capital allocation invested entirely in Silicon Valley is still correlated with US technology sector dynamics, USD strength, and Federal Reserve policy. Geographic diversification within alternatives creates a second layer of portfolio resilience.
The Emerging Market Premium

The data on emerging market alternatives is compelling when properly risk-adjusted:
Alternative Investment Returns by Geography (10-Year Annualized)
| Asset Class | North America | Western Europe | Asia-Pacific | Africa and Middle East |
|---|---|---|---|---|
| Private Equity | 14.2% | 12.8% | 16.4% | 18.1% |
| Venture Capital | 12.8% | 9.2% | 15.7% | 21.3% |
| Infrastructure | 9.4% | 8.1% | 11.2% | 13.8% |
| Private Credit | 8.2% | 6.9% | 9.8% | 12.4% |
Source: Compiled from Cambridge Associates, MSCI Private Capital, IFC Research. Figures represent indicative ranges based on top-quartile manager performance; actual returns vary significantly by vintage and manager selection.
The premium is not accidental. Emerging markets offer structural megaeconomic tailwinds that developed markets simply cannot replicate:
Demographic Megaforces:
- India adds the equivalent of Australia's population every 18 months
- Africa will add 1 billion people by 2050, with median age under 25
- Southeast Asia's middle class is growing by 30 million annually
- These are not projections subject to policy change; they are demographic momentum already in motion
Structural Economic Transitions:
- India's formalization: moving from 50% informal economy to digital payments and tax compliance
- Africa's mobile-first infrastructure: leapfrogging legacy systems entirely
- Southeast Asia's manufacturing shift: benefiting from supply chain diversification away from China
- Middle East's post-oil transformation: $1 trillion+ committed to economic diversification
Current Market Inefficiencies:
- Top-quartile African PE managers see 50x fewer LP meetings than comparable US managers
- Information asymmetries persist: most institutional research coverage is non-existent
- Pricing anomalies: identical business models trade at 3-5x lower multiples than developed market peers
- First-mover advantage: funds deploying now will define the ecosystem for decades
Why the Premium Persists:
Unlike developed market inefficiencies that arbitrage away quickly, emerging market premiums are sustained by structural barriers: governance complexity, currency volatility, and relationship-dependent deal flow. These barriers are exactly what patient, sophisticated family office capital is positioned to overcome.
The Venture Capital Geographic Allocation Case
Consider a 7% venture capital allocation within a family office portfolio. The conventional approach would place this entirely with top-quartile US managers. The sophisticated approach recognizes that venture returns are driven by:
- Entry valuations (lower in emerging markets)
- Growth rates of underlying economies (higher in emerging markets)
- Exit multiples relative to entry (often higher in emerging markets due to scarcity premium)
- Currency dynamics (potential tailwind from EM appreciation)
A venture allocation split 50% developed markets and 50% emerging markets historically delivered higher absolute returns with lower correlation to public equity markets than a 100% developed market allocation.
Recommended Venture Capital Geographic Split
| Region | Allocation | Rationale |
|---|---|---|
| United States | 35% | Deepest ecosystem, proven exits |
| Europe | 15% | Enterprise software strength, reasonable valuations |
| India | 20% | 1.4B population, digital infrastructure buildout |
| Southeast Asia | 15% | Rising middle class, fintech opportunity |
| Africa | 10% | Earliest stage, highest upside potential |
| Middle East | 5% | Sovereign capital concentration, regional champions |
Currency Strategy: The Overlooked Dimension
Most family offices treat currency as an afterthought or a risk to hedge away. This misses a significant opportunity. For families whose primary wealth is denominated in a single currency, deliberate currency diversification provides both risk reduction and return enhancement.
The Currency Correlation Problem
A European family office with EUR-denominated primary wealth and a "globally diversified" portfolio often discovers their actual currency exposure is far less diversified than they assumed:
- Global equity indices are 60-70% USD-denominated
- Most alternatives managers report in USD
- Even emerging market investments often have USD as the base currency
When the EUR weakens against USD, this family's portfolio rises in EUR terms, masking underlying performance issues. When EUR strengthens, they face a double headwind: weak dollar assets and compressed portfolio values.
Deliberate Currency Allocation
Sophisticated family offices treat currency as an asset class requiring explicit allocation:
Base Currency Diversification
- Hold 20-30% of liquid assets in non-home-currency deposits
- Prioritize currencies with different economic drivers than your primary wealth source
- For EUR-based families: meaningful GBP, CHF, and select EM currency exposure
- For USD-based families: EUR, JPY, and commodity currencies
Currency-Hedged vs. Unhedged Positions
- Hedge currency on fixed income (the volatility overwhelms the yield)
- Leave equities partially unhedged (currency adds diversification)
- Emerging market alternatives: accept currency risk as part of the return driver
The Emerging Market Currency Opportunity
Over 20-year horizons, select emerging market currencies have appreciated substantially against developed market currencies as economies mature. INR, IDR, and certain African currencies offer both yield advantage and potential appreciation for patient capital.
The Practical Implementation: A Model Family Office Allocation
Drawing these threads together, here is a model allocation for a family office with $500 million in investable assets whose primary wealth derives from a consumer-facing business:
Strategic Asset Allocation Framework
| Category | Subcategory | Allocation | Geographic Tilt |
|---|---|---|---|
| GROWTH ASSETS (55%) | |||
| Global Equities | 25% | Underweight consumer discretionary | |
| Private Equity | 18% | 60% developed, 40% emerging | |
| Venture Capital | 7% | 50% developed, 50% emerging | |
| Growth Credit | 5% | Focus on Asia-Pacific | |
| DEFENSIVE ASSETS (25%) | |||
| Investment Grade Bonds | 10% | Short duration, inflation-linked | |
| Private Credit | 8% | Asset-backed, floating rate | |
| Cash and Equivalents | 7% | Multi-currency | |
| REAL ASSETS (20%) | |||
| Infrastructure | 10% | Digital and energy transition | |
| Real Estate | 7% | Logistics, data centers | |
| Commodities and Gold | 3% | Direct exposure, not equities |
This allocation achieves several objectives:
- Reduces correlation with primary wealth source by underweighting consumer sectors and emphasizing infrastructure and technology
- Addresses the 60/40 problem by replacing bond duration with private credit and real assets that offer inflation protection
- Captures emerging market premium through deliberate geographic allocation within each alternative category
- Maintains liquidity through the public equity and cash allocations while accepting illiquidity premium in alternatives
Implementation Considerations: Manager Selection in Emerging Markets
The premium available in emerging market alternatives comes with a caveat: manager dispersion is significantly wider than in developed markets. The difference between top-quartile and bottom-quartile private equity returns in the US might be 800 basis points. In emerging markets, it can exceed 2,000 basis points.
This is both the risk and the opportunity. Selecting the wrong manager in Africa or Southeast Asia can destroy capital. Selecting the right manager can generate returns unavailable anywhere else.
Manager Selection Criteria for Emerging Market Alternatives
| Factor | What to Evaluate | Red Flags |
|---|---|---|
| Local Presence | Boots on ground, not fly-in visits | Investment team based in developed markets |
| Track Record | Realized returns, not paper marks | Heavy reliance on unrealized gains |
| Exit History | Actual liquidity events | Dependent on IPO markets that may not exist |
| LP Base | Sophisticated institutional backing | Retail or unsophisticated capital |
| Alignment | GP commitment, carried interest structure | Misaligned incentives, excessive fees |
| Operational Capability | Value creation beyond capital | Pure financial engineering approach |
The family office advantage here is meaningful. Unlike large institutional investors constrained by minimum check sizes and deployment timelines, family offices can:
- Invest in smaller, more nimble managers with genuine local expertise
- Accept longer hold periods that allow value creation to compound
- Build relationships before committing capital
- Co-invest in specific opportunities with known managers
The Sovereign Wealth Lessons Applied
Let us return to where we began: the sovereign wealth parallel. The most successful sovereign funds share characteristics that family offices would do well to emulate:
Long time horizons: Norway's fund has an explicit multi-generational mandate. Family offices should think in decades, not quarters.
First principles diversification: Sovereigns diversify away from their primary economic exposure. Family offices must do the same.
Geographic breadth: Major sovereign funds invest globally, capturing growth wherever it occurs. Domestic bias is a drag on returns.
Alternative depth: Sovereigns allocate heavily to illiquid alternatives, accepting complexity for premium returns. Family offices have the same capacity.
Operational excellence: Successful sovereigns build internal capabilities over time. Family offices should develop expertise rather than outsourcing everything.
The 60/40 portfolio was never designed for families with concentrated wealth sources and multi-generational time horizons. It was a simplification for retail investors who needed something easy to understand and cheap to implement.
Family offices deserve better. They deserve portfolios constructed with the same sophistication that guides trillions in sovereign capital. They deserve allocations that recognize their unique exposures and capitalize on their structural advantages.
The framework exists. The opportunities exist. The only question is whether family offices will embrace the complexity that genuine diversification requires.
Conclusion: From Correlation Blindness to Sovereign Sophistication
The 60/40 portfolio is not dead, but its limitations are now undeniable. For family offices whose wealth derives from operating businesses, it was always an inadequate framework. The correlation between primary wealth sources and traditional portfolio allocations creates hidden concentration risk that only becomes apparent during market stress.
The alternative is not complexity for its own sake. It is appropriate complexity: diversification that accounts for existing exposures, alternatives that offer genuine decorrelation, and geographic allocation that captures growth where it is actually occurring.
Sovereign wealth funds learned these lessons because they had to. When your mandate is preserving national wealth across generations, you cannot afford correlation blindness. Family offices face the same imperative. The capital they steward represents generations of value creation. It deserves allocation strategies equal to that responsibility.
The model presented here is a starting point, not a prescription. Every family's situation differs based on their primary wealth source, risk tolerance, liquidity needs, and return objectives. But the underlying principles are universal:
Know your existing exposures. Diversify away from them. Capture premiums where they exist. Think in generations, not years.
This is how sovereign wealth funds preserve and grow national patrimony. It is how family offices should preserve and grow family patrimony. The tools are the same. The sophistication should be the same. The outcomes can be the same.
The question is not whether to evolve beyond 60/40. The question is how quickly you can make that evolution while the opportunities remain available.