
Introduction: The Real Problem With How Family Offices Invest
Everyone has written about 60/40 being dead. I'm not going to rehash that argument. What I want to address is more uncomfortable: why do most family offices underperform in alternatives, even when they allocate correctly?
The answer has nothing to do with 60/40. It has everything to do with governance, decision-making, and the gap between institutional best practices and how family offices actually operate.
I've watched family offices make the "right" allocation to alternatives (30%, 40%, even 50% of their ) and still underperform because:
- They accessed third-quartile managers through wealth management relationships
- They panicked during their first capital call in a downturn and stopped funding commitments
- Family dynamics led to exit demands that forced sales at the worst time
- They lacked the governance to say no to a family member's "great opportunity"
The 60/40 breakdown matters, but solving it requires more than shifting allocation percentages. It requires honest assessment of whether your family office has the governance, patience, and expertise to actually execute an alternatives strategy.
Key Takeaways
- 60/40 is broken: 2022 saw both stocks (-18%) and bonds (-13%) fall together, the worst since 1937
- Correlation shift: Stock-bond correlation turns positive when inflation exceeds 3%
- Illiquidity premium: Private equity outperforms public markets by 300-500 bps annually over 20 years
- Allocation rule of thumb: Target 15-20% alternatives per decade of time horizon
- Inflation hedge: Portfolios with 40%+ real assets saw 70% less purchasing power erosion
- Fee management: Co-investments and scale can reduce all-in costs by 50%+
For family offices with multi-generational time horizons, continuing to follow the 60/40 model is not conservative investing. It's ignoring evidence. The question is no longer whether to increase alternative allocations, but how much and in what form.
The Global Family Office Landscape (2025)
Before diving into strategy, understanding the scale and behavior of family office capital provides important context.
Global Family Office Statistics (2025):
| Metric | Value | Trend |
|---|---|---|
| Total Family Offices Globally | 10,000+ | +8% annually |
| Combined AUM | $6+ trillion | +10% annually |
| Average Single-Family Office AUM | $900M | Growing |
| Average Multi-Family Office AUM | $2.5B | Growing |
| % Allocating to Alternatives | 45% | +15% vs. 2020 |
Source: UBS Global Family Office Report 2025
Current Average Allocations (Large Family Offices $1B+):
| Asset Class | 2020 | 2023 | 2025 | Direction |
|---|---|---|---|---|
| Public Equities | 32% | 28% | 26% | Declining |
| Fixed Income | 18% | 15% | 12% | Declining |
| Real Estate | 15% | 17% | 18% | Growing |
| Private Equity | 14% | 18% | 21% | Growing |
| Hedge Funds | 8% | 6% | 5% | Declining |
| Private Credit | 5% | 8% | 10% | Growing |
| Cash | 8% | 8% | 8% | Stable |
Source: Campden Wealth Global Family Office Report 2025
The Structural Case Against 60/40
Understanding why 60/40 has failed requires examining three interconnected shifts:
1. The Yield Compression Problem
The 40-year bull market in bonds ended with the Federal Reserve's 2022 tightening cycle. But even before rate increases, bond mathematics had become hostile to wealth preservation:
Historical Bond Market Dynamics:
| Metric | 1980 | 2000 | 2020 | 2025 |
|---|---|---|---|---|
| 10-Year Treasury Yield | 12.8% | 6.0% | 0.9% | 4.3% |
| Real Yield (after inflation) | 8.5% | 2.5% | -0.7% | 1.8% |
| Duration Risk (price change per 1% rate move) | 6.2 | 7.8 | 11.4 | 8.5 |
| Bond Bull Market Return (prior decade) | N/A | +9.2% | +4.8% | -1.2% |
Source: Federal Reserve Economic Data (FRED)
According to J.P. Morgan Asset Management's 2025 Long-Term Capital Market Assumptions, expected bond returns.over the next decade remain below historical averages despite higher yields, while duration risk has increased substantially.
2. The Correlation Breakdown
The fundamental premise of 60/40, negative stock-bond correlation, has reversed. Analysis by AQR Capital Management demonstrates that stock-bond correlations have turned persistently positive when inflation exceeds 3%, a condition that may characterize the coming decade.
Stock-Bond Correlation by Inflation Regime:
| Inflation Environment | Stock-Bond Correlation | Historical Periods |
|---|---|---|
| Below 2% | -0.25 to -0.40 | 2010-2020 |
| 2-3% | -0.10 to +0.10 | 2003-2007 |
| 3-5% | +0.20 to +0.40 | 2021-2023 |
| Above 5% | +0.40 to +0.60 | 1970s, 2022 |
Source: AQR Research, Bloomberg
This means bonds no longer provide reliable diversification precisely when investors need it most, during equity drawdowns driven by inflation or monetary policy concerns.
3. The 2022 Revelation
The 2022 market provided a stark demonstration of 60/40 failure:
2022 Performance by Asset Class:
| Asset Class | 2022 Return | 60/40 Contribution |
|---|---|---|
| S&P 500 | -18.1% | -10.9% |
| Bloomberg Agg Bond | -13.0% | -5.2% |
| **60/40 Portfolio** | **-16.1%** | **Worst since 1937** |
| Private Real Estate | +7.1% | N/A (not in 60/40) |
| Private Credit | +4.2% | N/A |
| Infrastructure | +5.8% | N/A |
Source: Bloomberg, NCREIF, Cambridge Associates
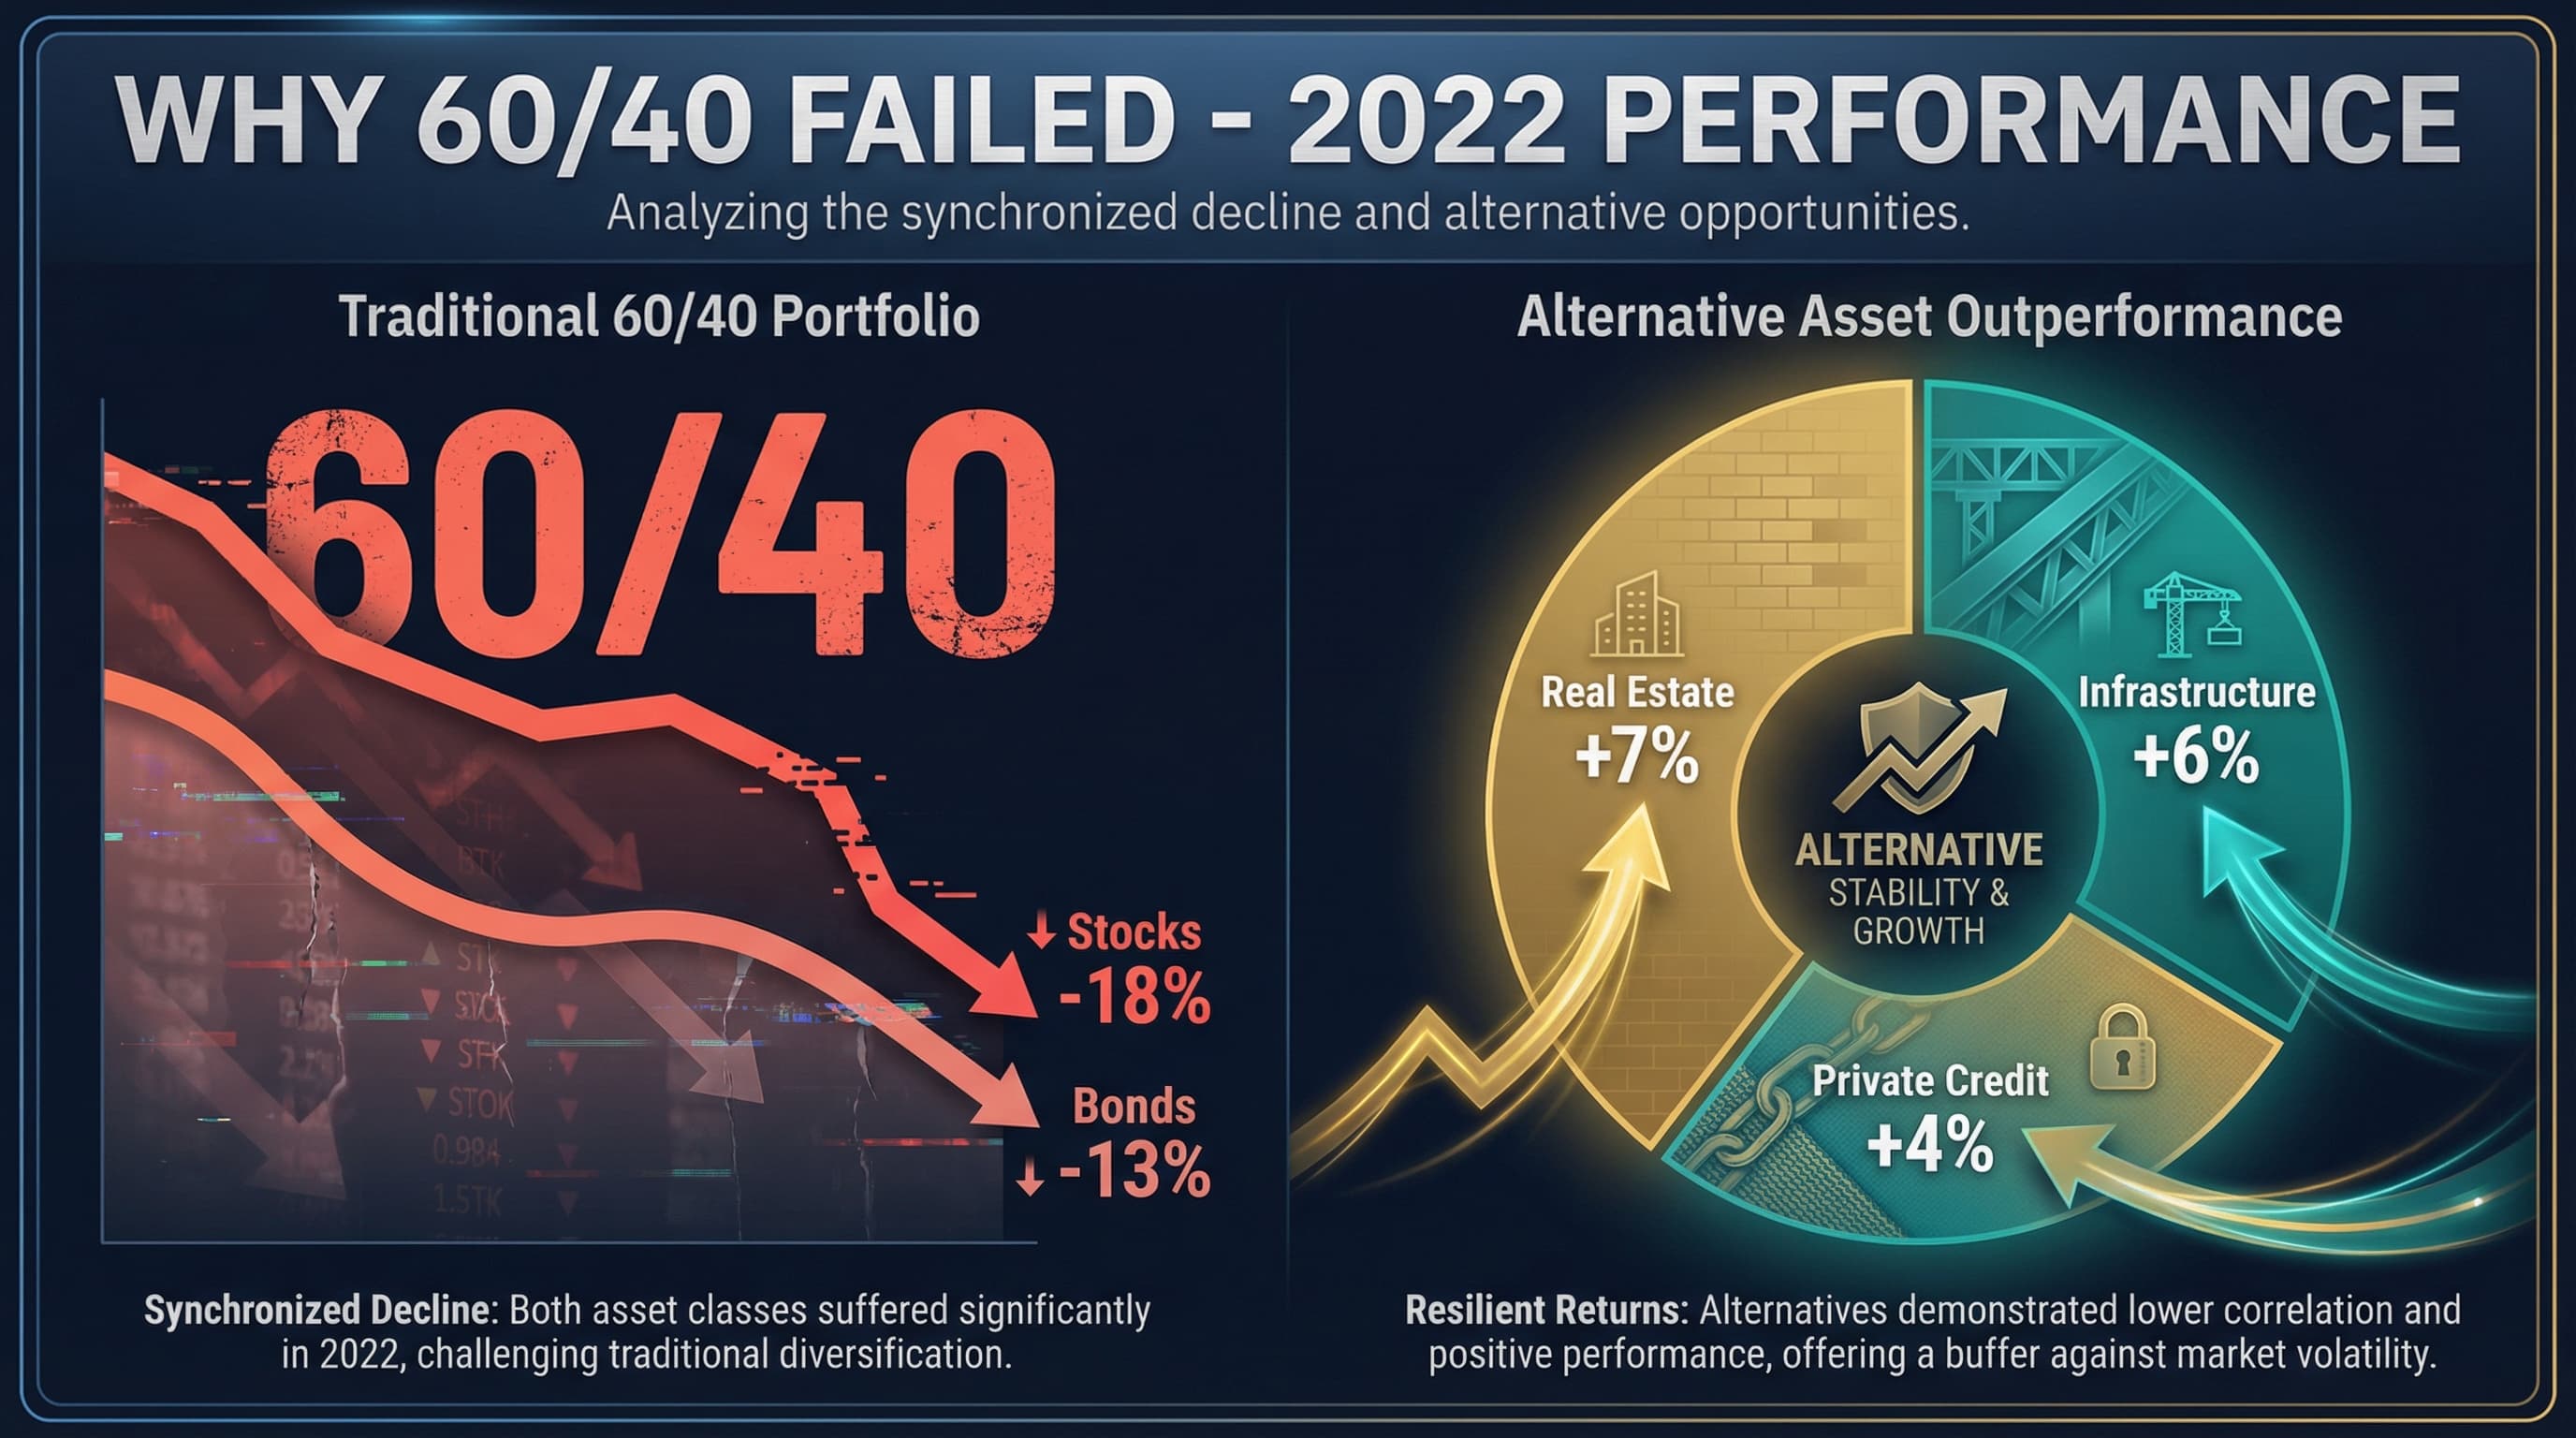
A traditional 60/40 portfolio offered no protection against the one risk that most threatens multi-generational wealth preservation: purchasing power erosion.
The Alternative Investment Case
Alternative investments (private equity, real estate, infrastructure, credit, natural resources) offer structural advantages that address each failure mode of the 60/40 portfolio.
1. The Illiquidity Premium: Why Most Don't Capture It
Patient capital can theoretically capture returns.that liquid markets cannot access. Cambridge Associates' research shows the median private equity fund has outperformed public markets by 300-500 basis points annually over 20-year periods.
Private Equity vs. Public Markets (1996-2025):
| Metric | Private Equity (Median) | S&P 500 | Spread |
|---|---|---|---|
| 10-Year Net IRR | 14.2% | 10.1% | +4.1% |
| 15-Year Net IRR | 13.8% | 9.4% | +4.4% |
| 20-Year Net IRR | 12.9% | 8.2% | +4.7% |
| Top Quartile 20-Year | 17.2% | 8.2% | +9.0% |
Source: Cambridge Associates Private Equity Benchmark 2025
Here's the uncomfortable truth: these returns assume you stay invested through the entire cycle, meet every capital call, and don't sell secondary in a panic. Most family offices don't.
I've seen families who committed to "long-term" alternatives programs liquidate them in year 4 because:
- A divorce required liquidity
- The next generation wanted out of "Dad's investments"
- The CIO who championed alternatives left, and the replacement didn't understand them
- A single high-profile blowup (like a headline-making fraud) made the family uncomfortable with the whole asset class
The illiquidity premium is real, but it only accrues to those who actually stay illiquid. Before allocating, families must honestly assess: do we have the governance structure to stay the course when it's uncomfortable?
2. True Diversification
Alternatives provide return streams with genuinely low correlation to traditional assets:
Asset Class Correlations (2015-2025):
| Asset Class | Correlation to S&P 500 | Correlation to Bonds | Volatility |
|---|---|---|---|
| Public Equity | 1.00 | -0.05 to +0.35 | 16% |
| Core Real Estate | 0.28 | 0.12 | 8% |
| Infrastructure | 0.38 | 0.18 | 10% |
| Private Credit | 0.42 | 0.22 | 6% |
| Private Equity | 0.58 | 0.08 | 14% |
| Natural Resources | 0.32 | -0.08 | 18% |
| Hedge Funds | 0.65 | 0.15 | 7% |
Source: Blackstone Alternative Asset Management 2025
These correlations persist because private market valuations are driven by cash flows and fundamentals rather than daily market sentiment.
3. Inflation Protection
Real assets (property, infrastructure, commodities) provide natural inflation hedges. When prices rise, so do rents, tolls, and commodity values.
Asset Class Performance During Inflationary Periods:
| Asset Class | High Inflation Return (>4%) | Low Inflation Return (<2%) | Spread |
|---|---|---|---|
| US Equities | +4.2% | +11.8% | -7.6% |
| Bonds | -2.1% | +6.2% | -8.3% |
| Real Estate | +8.4% | +7.1% | +1.3% |
| Infrastructure | +9.1% | +6.8% | +2.3% |
| Commodities | +12.6% | +1.2% | +11.4% |
| Private Credit | +7.8% | +5.9% | +1.9% |
Source: KKR Research: Real Assets and Inflation Protection 2025
KKR's research found that portfolios with 40%+ real asset allocation experienced 70% less purchasing power erosion during inflationary periods compared to traditional allocations.
A Framework for Alternative Allocation
How much should alternatives represent in a family office portfolio? The answer depends on three factors:
1. Time Horizon
Allocation Guideline by Time Horizon:
| Time Horizon | Recommended Alternatives % | Rationale |
|---|---|---|
| 10 years | 15-25% | Limited illiquidity tolerance |
| 20 years | 30-40% | Moderate illiquidity tolerance |
| 30+ years | 45-60% | Full illiquidity premium capture |
| Perpetual | 50-70% | Maximum premium capture |
2. Liquidity Needs Assessment
Before allocating, families must honestly assess liquidity requirements:
Liquidity Planning Framework:
| Category | Definition | Typical Range |
|---|---|---|
| Operating Needs | Annual lifestyle + operating expenses | 2-3% of wealth |
| Contingency Reserve | Unexpected expenses, opportunities | 5-10% of wealth |
| Strategic Reserve | Business opportunities, family support | 10-15% of wealth |
| Committed Capital | Future PE/RE capital calls | 15-20% of wealth |
| **Minimum Liquidity** | Sum of above | **35-50% of wealth** |
Guideline: Maintain liquid reserves equal to 5 years of expected needs plus a stress-test buffer (typically 20-30% additional).
3. Implementation Capability
Capability Assessment Matrix:
| Capability | Basic | Intermediate | Advanced |
|---|---|---|---|
| Manager Selection | Fund of funds | Direct PE/RE | Co-invest, direct deals |
| Due Diligence | Outsourced | Internal + external | Fully internal |
| Portfolio Construction | Single strategy | Multi-strategy | Complex multi-asset |
| Monitoring | Quarterly reports | Monthly analysis | Real-time dashboards |
| Appropriate Alternatives % | 15-25% | 25-40% | 40-60%+ |
Model Allocations by Profile
Based on these factors, we propose three model allocations:
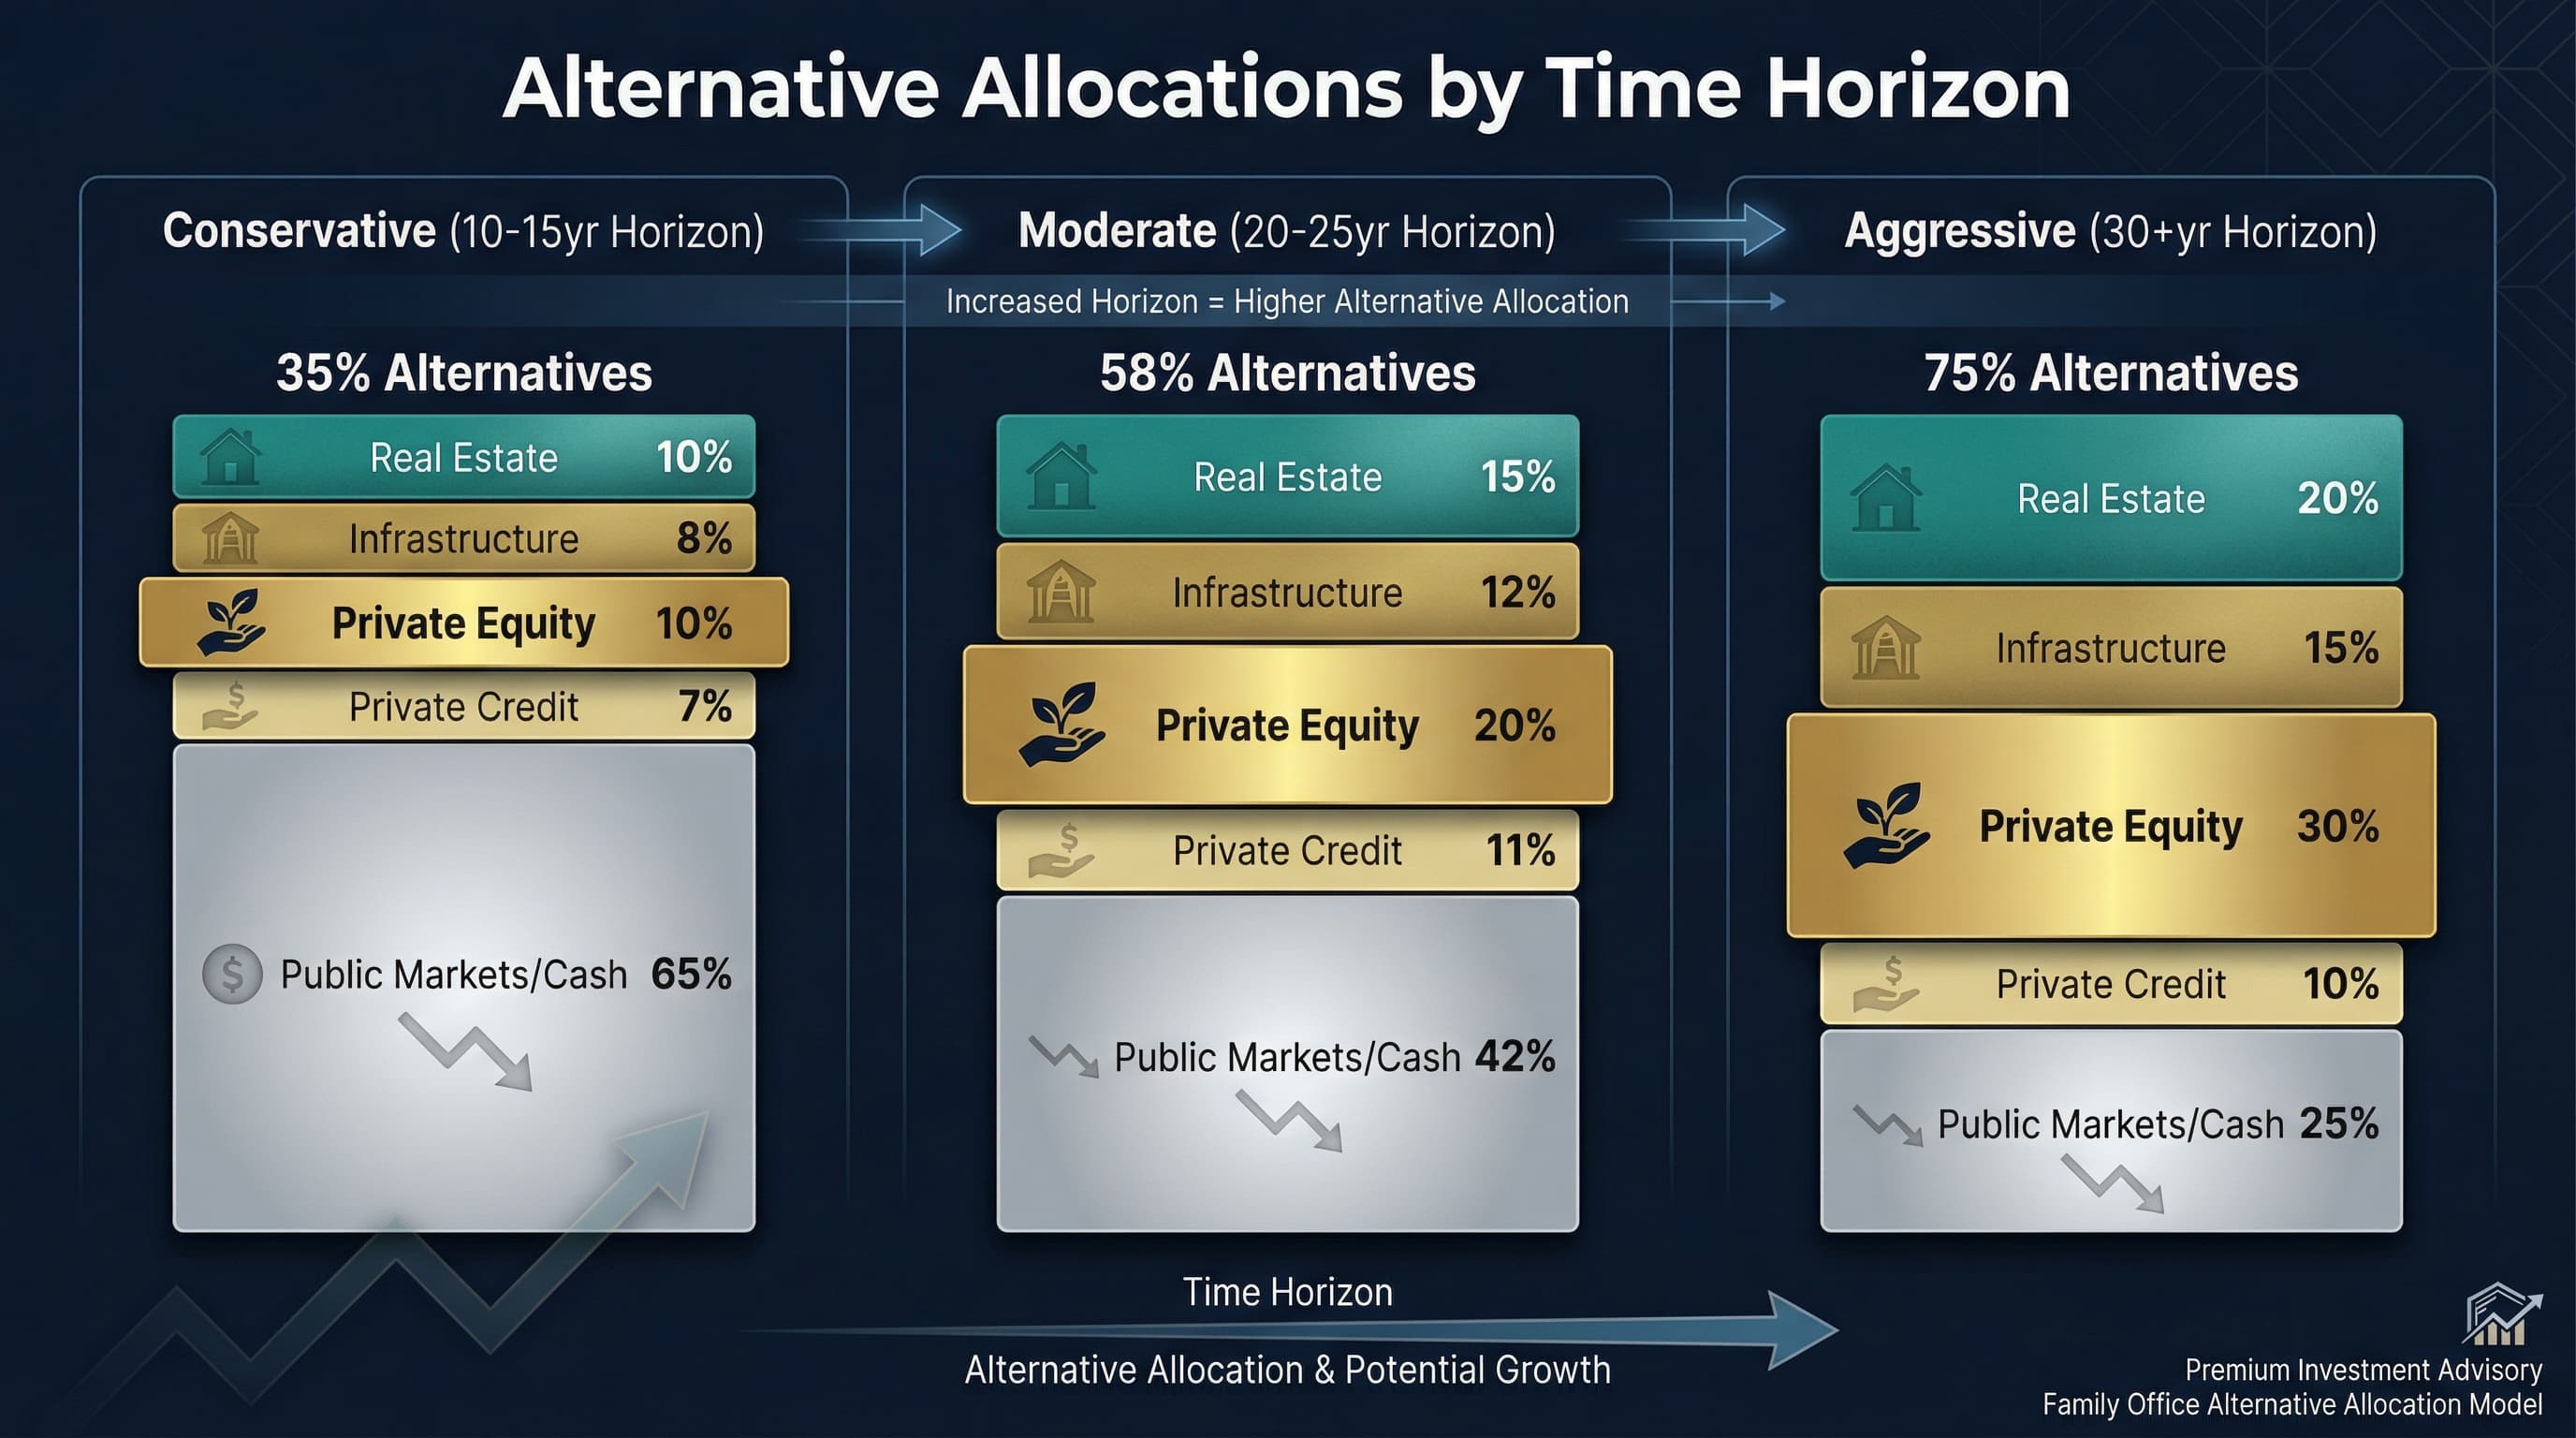
Conservative Family Office (10-15 year horizon, higher liquidity needs)
| Asset Class | Allocation | Role |
|---|---|---|
| Public Equities | 35% | Growth, liquidity |
| Fixed Income | 20% | Income, stability |
| Real Estate | 15% | Inflation hedge, income |
| Infrastructure | 10% | Stable cash flows |
| Private Credit | 10% | Yield enhancement |
| Cash | 10% | Liquidity, optionality |
| **Alternatives Total** | **35%** |
Moderate Family Office (20-25 year horizon, moderate liquidity)
| Asset Class | Allocation | Role |
|---|---|---|
| Public Equities | 25% | Growth, liquidity |
| Fixed Income | 10% | Tactical allocation |
| Real Estate | 20% | Core holding |
| Infrastructure | 15% | Cash flow generation |
| Private Equity | 15% | Return enhancement |
| Private Credit | 8% | Yield, diversification |
| Cash | 7% | Liquidity |
| **Alternatives Total** | **58%** |
Aggressive Family Office (30+ year horizon, minimal liquidity needs)
| Asset Class | Allocation | Role |
|---|---|---|
| Public Equities | 15% | Liquidity, rebalancing |
| Fixed Income | 5% | Tactical only |
| Real Estate | 25% | Core foundation |
| Infrastructure | 15% | Stable returns. |
| Private Equity | 22% | Return engine |
| Venture Capital | 5% | Optionality |
| Natural Resources | 8% | Inflation protection |
| Cash | 5% | Minimum liquidity |
| **Alternatives Total** | **75%** |
The Emerging Markets Opportunity
Within alternative allocations, emerging markets deserve special attention. For detailed analysis of one compelling opportunity, see our guide to West African Real Estate Investment.
Emerging Markets Alternatives Comparison:
| Market | Strategy | Expected Net IRR | Key Risk |
|---|---|---|---|
| West Africa | Real Estate | 18-22% | Currency, governance |
| Southeast Asia | Infrastructure | 12-16% | Political, execution |
| MENA | Private Credit | 10-14% | Concentration, FX |
| Latin America | Agriculture | 14-18% | Commodity, weather |
| India | Growth Equity | 18-24% | Valuation, exit |
Source: Proteus analysis, Cambridge Associates EM Benchmark
For guidance on accessing Gulf capital for these opportunities, see Understanding Gulf Investors.
Implementation: Where Family Offices Actually Fail
Before discussing frameworks, let's be honest about what goes wrong:
The Hidden Costs of Alternatives
Everyone knows about management fees and carry. Here's what family offices often miss:
Total Cost Reality:
| Cost Type | Visible? | Typical Range | Notes |
|---|---|---|---|
| Management fee | Yes | 1.5-2.0% | On committed capital, not NAV |
| Carried interest | Yes | 20% of profits | Above hurdle |
| Administrative/legal | Sometimes | 0.2-0.5% | Fund expenses |
| Capital call costs | No | 0.3-0.8% | Opportunity cost of reserves |
| Monitoring time | No | Significant | Internal resource drain |
| Governance overhead | No | High | Committee time, reporting |
| Secondary discount if exit needed | No | 15-30% | Liquidity cost |
When you add all costs, a 2/20 fund costs 4-6% annually, not 2%. Family offices with <$500M in alternatives often can't access institutional terms and pay even more.
Manager Selection: Why Access Matters More Than Due Diligence
Due Diligence Criteria by Weight:
| Criterion | Weight | Key Questions |
|---|---|---|
| Team Quality & Stability | 25% | Tenure, succession, alignment |
| Track Record | 25% | Attribution, consistency, vintage |
| Strategy Clarity | 20% | Differentiation, repeatability |
| Operational Infrastructure | 15% | Back office, reporting, compliance |
| Terms & Alignment | 15% | Fees, GP commit, governance |
Here's the problem: This framework assumes you have access to top-quartile managers. Most family offices don't.
Top-quartile PE funds are oversubscribed. They choose their LPs. And they prefer $50M+ commitments from institutions with decades of relationship history. A $10M commitment from a new family office? They'll take it if they have room, but you're not their priority.
This creates a vicious cycle: family offices get access to funds that need them (often third-quartile managers), not funds they need (first-quartile managers). The families then underperform, conclude "alternatives don't work," and exit, missing the point entirely.
Vintage Year Diversification
Building a diversified private markets portfolio requires patience:
Recommended Commitment Pace:
| Year | Annual Commitment (% of Target) | Cumulative Exposure |
|---|---|---|
| Year 1 | 20-25% | 20-25% |
| Year 2 | 20-25% | 40-50% |
| Year 3 | 20-25% | 60-75% |
| Year 4 | 15-20% | 75-95% |
| Year 5+ | Maintain/Rebalance | 100% |
Fee Management
Fee Comparison by Strategy:
| Strategy | Management Fee | Carried Interest | All-In Cost (Est.) |
|---|---|---|---|
| Private Equity | 1.5-2.0% | 20% | 4-6% annually |
| Real Estate | 1.0-1.5% | 15-20% | 2-4% |
| Infrastructure | 1.0-1.5% | 15-20% | 2-3% |
| Private Credit | 1.0-1.5% | 15% | 2-3% |
| Co-Investments | 0-0.5% | 0-10% | 0.5-2% |
Fee Reduction Strategies:
- Scale-based fee negotiations ($50M+ commitments)
- Co-investment rights (often no fee/low fee)
- Emerging manager fee concessions
- Long-term LP relationships
Key Takeaways
- 60/40 is structurally broken: Positive stock-bond correlation and compressed yields undermine the fundamental premise
- Illiquidity premium is substantial: Patient capital can capture 300-500 bps of additional return annually
- Real assets hedge inflation: Property, infrastructure, and commodities protect purchasing power when traditional assets fail
- Allocation should match horizon: 15-20% alternatives per decade of time horizon is a practical guideline
- Implementation requires capability: Don't increase complexity faster than expertise grows
- Emerging markets offer premium returns. West Africa, Southeast Asia, MENA offer opportunities unavailable in developed markets
- Fee management matters: Co-investments and scale can reduce all-in costs by 50%+
Before You Increase Alternatives: A Governance Checklist
The allocation percentages matter less than your ability to execute. Before moving to higher alternatives exposure, answer honestly:
Can you answer "yes" to all of these?
- [ ] We have a written investment policy that all family stakeholders have signed
- [ ] Our liquidity needs are defined for the next 10+ years, including stress scenarios
- [ ] Family governance can prevent any individual from demanding early exits
- [ ] We have someone (internal or external) who can conduct real due diligence, not rely on wealth managers
- [ ] We can commit $10M+ per relationship to access quality managers
- [ ] We understand that the next 3 years of reported performance will look terrible (J-curve)
- [ ] We will not panic when our PE allocation shows a 15% paper loss in year 2
- [ ] Our family dynamics won't change in ways that require liquidity (divorces, succession fights, estate issues)
If you answered "no" to any of these, fix the governance problem before increasing alternatives exposure. More allocation with broken governance leads to worse outcomes, not better.
For family offices that can honestly check all boxes: the case for alternatives is compelling. Patient capital, diversification, and inflation protection are structurally valuable. The question isn't whether alternatives work. It's whether your family can actually capture the premium.
For those exploring emerging manager fundraising, we also offer placement and capital raising services.
If you want a candid assessment of whether your governance can support an alternatives program, contact us. We'll tell you the truth, including if you should wait.
Sources & References:
- J.P. Morgan Asset Management (2025). "Long-Term Capital Market Assumptions"
- AQR Capital Management (2025). "Stock-Bond Correlation: Regime Changes"
- Cambridge Associates (2025). "Private Equity Index and Benchmark Statistics"
- Blackstone (2025). "Alternative Investments: A Primer for Family Offices"
- KKR (2025). "Real Assets and Inflation Protection"
- Preqin (2025). "Global Alternatives Report"
- UBS (2025). "Global Family Office Report"
- Campden Wealth (2025). "Global Family Office Report"
- Federal Reserve (2025). "Economic Data (FRED)"
- Bloomberg (2025). "Multi-Asset Analysis"