
Introduction: The End of Market Primacy
For forty years, the consensus held that markets allocate capital better than governments. Industrial policy was considered a relic, associated with failed state planning and inefficient subsidies.
That consensus has collapsed.
The United States, capitalism's standard-bearer, has enacted the most aggressive industrial policy since World War II. The Inflation Reduction Act alone directs $369 billion toward clean energy. The CHIPS Act adds $280 billion for semiconductor manufacturing. Combined with defense spending, infrastructure investment, and Buy America provisions, total industrial policy spending exceeds $2 trillion.
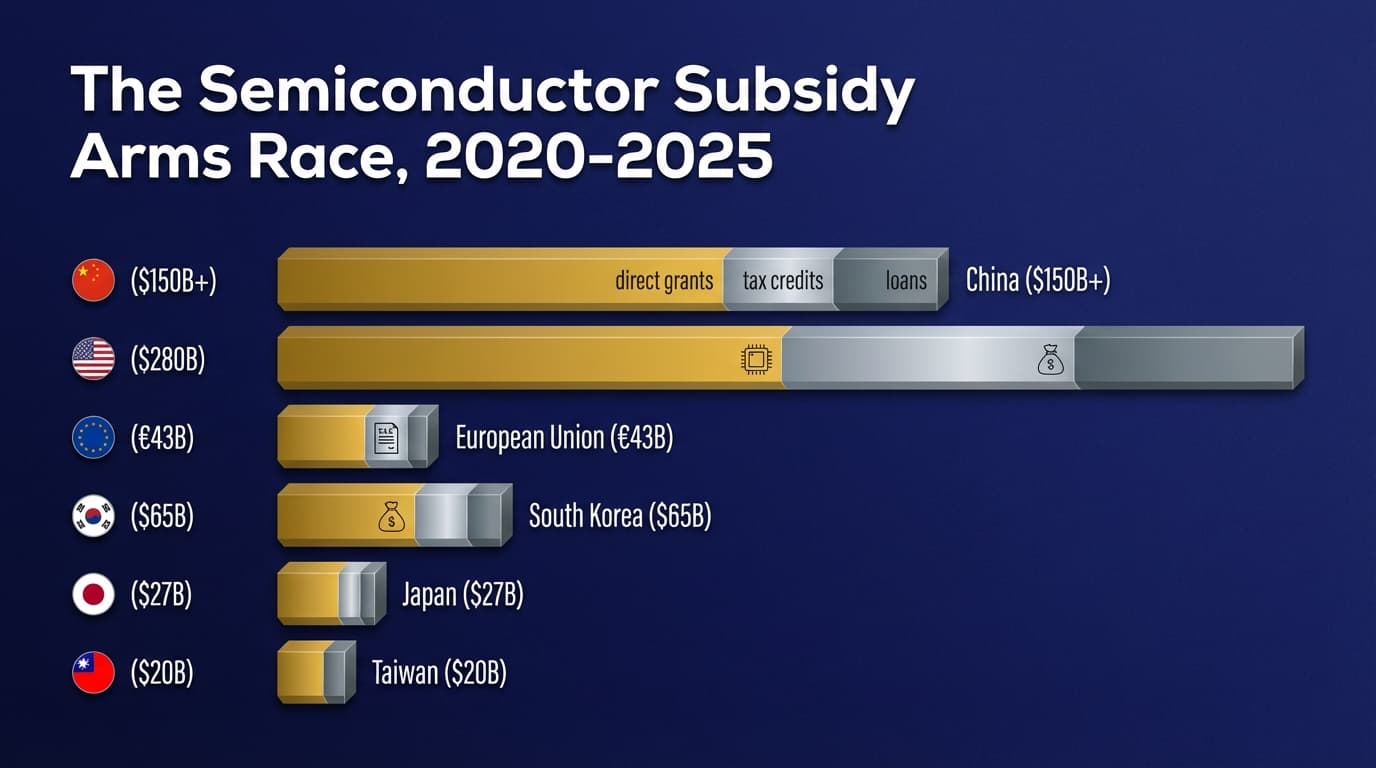
The scale is staggering. The chart above captures what may be the largest coordinated industrial policy effort in history. The United States leads with $280 billion through the CHIPS Act. China has committed $140 billion, though restrictions on equipment access limit effectiveness. The European Union's Chips Act adds €43 billion. Japan, South Korea, Taiwan, and India follow with their own multi-billion dollar programs. Total global semiconductor subsidies now exceed $400 billion, more than the GDP of many nations.
Key Takeaways
- Unprecedented scale: US industrial policy spending exceeds $2 trillion through IRA, CHIPS Act, and infrastructure programs—the largest since World War II
- IRA political durability: 70% probability that tax credits survive through 2030, as benefits flow disproportionately to Republican districts, creating bipartisan constituencies
- Actual costs far exceed headlines: 60% probability that IRA spending exceeds $1 trillion by 2032, far above the $369 billion official estimate
- CBAM trade protection: Europe's Carbon Border Adjustment Mechanism will generate €10B+ annually by 2028, protecting EU industrials from carbon arbitrage
- China's mixed outcomes: Solar dominance (80%+ share) continues, but semiconductor self-sufficiency faces structural limits from equipment restrictions
- Winners are policy-aligned: Overweight renewable manufacturing, grid infrastructure, semiconductor equipment; underweight unsubsidized competitors
The New Industrial Policy Framework
Why Now? The Convergence of Crises
Multiple crises converged to discredit market primacy:
1. Supply Chain Vulnerability
COVID exposed just-in-time globalization's fragility. A single ship blocking the Suez Canal disrupted global commerce. Semiconductor shortages shuttered auto plants. The lesson: efficiency without resilience is vulnerability.
2. Climate Imperative
The energy transition requires industrial transformation at unprecedented speed and scale. Markets alone cannot mobilize capital fast enough. Government direction through subsidies, mandates, and carbon pricing accelerates deployment.
3. Competitive Nationalism
China's state-directed model achieved what markets predicted impossible: technological catch-up across strategic sectors. Western nations concluded that competing with state capitalism requires state capitalism.
4. Political Economy
Deindustrialization hollowed out communities and fueled populism. Reshoring manufacturing addresses both economic and political imperatives. Industrial policy is now electoral strategy.
Key Forecasts: Industrial Policy Persistence
United States: IRA and CHIPS Durability
Our forecasts reflect cautious optimism about American industrial policy persistence. We assign 70% probability that IRA tax credits survive political transition through 2030 since the program's design makes it remarkably resilient to partisan attack. Domestic semiconductor production presents a steeper challenge: we give only 40% odds that US fabs will exceed 20% of global output by 2030, reflecting the enormous capital requirements and competition from established Asian producers. Electric vehicle production carries better odds at 55% probability of exceeding 3 million vehicles annually by decade's end, supported by massive automaker commitments already announced. Perhaps most striking: we see 60% probability that actual IRA spending will exceed $1 trillion by 2032, far above the $369 billion headline figure. Uncapped tax credits and stronger-than-expected adoption drive this projection.
Analysis: The IRA's design makes it politically resilient. Credits flow disproportionately to Republican districts and red states receive 60%+ of clean energy investment. Representatives who voted against the IRA now tout projects in their districts. Repealing popular subsidies that create local jobs proves politically difficult regardless of ideology.
Moreover, corporate commitments are locked in. $200B+ in announced investments cannot easily reverse. Even skeptical administrations will maintain momentum rather than forfeit first-mover advantages to China.
Investment Implication: IRA beneficiaries represent structural winners regardless of political uncertainty. Solar manufacturing, battery production, green hydrogen, and grid infrastructure benefit from durable support.
European Industrial Strategy
Europe's industrial policy trajectory differs markedly from America's subsidy-heavy approach. We assign 65% probability that the Carbon Border Adjustment Mechanism (CBAM) will generate more than €10 billion annually by 2028, creating a substantial revenue stream while protecting European industry from carbon arbitrage. Green hydrogen faces longer odds: only 45% probability of European production exceeding 5 GW by 2030, reflecting high costs and infrastructure gaps. Battery cell production carries similar skepticism at 40% odds of reaching 500 GWh capacity by decade's end, as Europe entered the battery race late and faces fierce Asian competition. The Net Zero Industry Act's ambition to mobilize €100 billion by 2030 carries coin-flip odds at 50%, constrained by the EU's fragmented fiscal capacity compared to American federal spending power.
Analysis: Europe's industrial policy operates through regulation rather than subsidies. The Carbon Border Adjustment Mechanism (CBAM) taxes imports based on embedded carbon, protecting European industry from "carbon leakage" while generating revenue. The mechanism phases in through 2026, creating transition urgency for trading partners.
Europe's constraint is fiscal capacity. Unlike the US, EU members cannot coordinate unlimited deficit spending. Industrial policy must operate through existing budget frameworks, limiting ambition relative to American spending.
Investment Implication: European industrials benefit from carbon border protection. Green steel, low-carbon cement, and aluminum producers gain competitive advantage as CBAM phases in. Trade compliance creates consulting and technology opportunities.
China: State Capitalism Evolution
China's industrial policy outcomes divide sharply between sectors with and without Western restrictions. In solar manufacturing, where China faces no technology constraints, we assign 75% probability that Chinese producers maintain their dominant 80%+ global market share through 2030. The same dominance extends to batteries: 70% probability that China captures over 60% of the global EV battery market by decade's end. BYD's automotive ambitions carry 60% odds of achieving top-3 global automaker status by volume by 2028, as the company is already scaling production faster than legacy automakers can respond. But semiconductors tell a different story: only 35% probability that China achieves 50% self-sufficiency in chips by 2030. US export controls on advanced manufacturing equipment create a ceiling that hundreds of billions in subsidies cannot break through.
Analysis: China's industrial policy never ended; it evolved. While Western nations rediscovered state direction, China refined its model. The approach combines: massive R&D spending (2.4% of GDP), preferential financing through state banks, protected domestic markets for scale, and strategic acquisition of foreign technology.
The semiconductor sector reveals both power and limits. Despite $140B+ investment, China remains dependent on foreign equipment for advanced nodes. US export controls constrain progress. Full self-sufficiency remains distant; partial self-sufficiency in mature nodes is achievable.
Investment Implication: China's industrial policy creates global overcapacity in targeted sectors (solar, batteries, EVs). Global competitors face margin pressure. Invest in segments where China lacks advantages (advanced semiconductors, aerospace) or where localization mandates protect markets.
Sector Analysis: Winners and Losers
Clear Winners: Policy-Defined Advantages
1. Renewable Energy Manufacturing
The IRA creates extraordinary incentives across the clean energy value chain. US solar manufacturing receives a 30% Investment Tax Credit plus domestic content bonuses, together targeting 10x capacity expansion by 2030. Battery production enjoys a $35/kWh production credit that has triggered explosive growth announcements from both domestic startups and Asian giants establishing American facilities. Wind component manufacturing, supported by tax credits and local content rules, is actively reshoring after decades of import dependence. Perhaps most transformative is green hydrogen: the $3/kg production tax credit essentially creates a new industry from scratch, and at $3 per kilogram, US-produced green hydrogen becomes cost-competitive with gray hydrogen derived from natural gas.
The IRA's production tax credits transform economics. Solar modules manufactured domestically receive credits exceeding current market prices. The rational response: build domestic capacity regardless of current cost disadvantages.
Investment Thesis: Invest in domestic manufacturing capacity before it's built. First movers secure credits and scale advantages. Winners include established manufacturers adding US capacity and pure-play domestic producers.
2. Grid Infrastructure
The energy transition requires grid transformation. Current US transmission capacity is inadequate for renewable integration. The IRA allocates $60B+ for grid modernization, but the total investment required dwarfs even this substantial commitment.
Transmission lines represent the largest gap: over $300 billion needed by 2030 to connect renewable generation sites to demand centers. The IRA addresses this through tax credits and permitting reform that accelerates project timelines. Grid-scale storage, projected to reach 1,000 GW by 2040, now qualifies for Investment Tax Credit eligibility, transforming project economics. Smart grid technology requires an additional $100 billion or more, supported through utility incentive programs that reward modernization investments.
Investment Thesis: Grid infrastructure is the bottleneck. Renewable generation without transmission is stranded. Invest in transmission developers, grid storage, and power management technology.
3. Semiconductor Manufacturing
The CHIPS Act represents unprecedented semiconductor industrial policy, deploying resources across the entire innovation pipeline. Manufacturing subsidies totaling $52 billion provide direct support for fab construction, enabling projects that would otherwise fail commercial hurdles given the $20-30 billion cost of a leading-edge facility. The Act allocates $200 billion for R&D funding focused on long-term competitiveness in next-generation technologies. An additional $24 billion in tax credits provides ongoing investment incentives that shift break-even calculations for capacity additions.
Intel, TSMC, and Samsung have announced $200B+ in US fab investments. These commitments respond directly to policy incentives.
Investment Thesis: Semiconductor manufacturing equipment benefits regardless of which fabs succeed. ASML, Applied Materials, and Lam Research capture spending across all policy-driven capacity additions.
Challenged Sectors: Policy Victims

1. Unsubsidized Import Competitors
Companies competing against subsidized production face structural disadvantage that no operational excellence can overcome. Commodity chemical producers compete against Chinese state-owned enterprises that receive below-market financing and face minimal profit requirements. Steel and aluminum producers face CBAM at export while contending with subsidized competition in their home markets, squeezed on both sides. Traditional automakers confront the most challenging competitive dynamics: legacy manufacturers must defend ICE market share while funding EV transitions that compete against purpose-built electric vehicle companies receiving substantial subsidies.
2. Carbon-Intensive Exports
CBAM creates explicit export penalties for carbon-intensive production. Iron and steel face the heaviest burden given their high emissions intensity and large trade volumes. Cement producers discover that their product's weight limits export economics even before carbon penalties apply. Aluminum smelting, among the most electricity-intensive manufacturing processes, concentrates in low-cost power regions that often mean high-carbon grids. Fertilizer production, particularly ammonia, faces both direct emissions exposure and natural gas input costs. Hydrogen, ironically included despite being central to decarbonization, faces CBAM on gray hydrogen exports while green hydrogen remains too expensive for most applications.
Adaptation Requirement: Decarbonize or face competitive disadvantage. Investment required for low-carbon production processes, and the sooner the better, as CBAM phases in progressively.
The Subsidy Arms Race
Escalation Dynamics
Industrial subsidies trigger competitive responses in a pattern that economists recognize but cannot halt. The US enacted the IRA with $369 billion for clean energy, immediately reshaping competitive dynamics for every trading partner. The EU responded with its Net Zero Industry Act to prevent capital flight to American subsidies. Japan announced a $150 billion green investment fund to maintain competitiveness in industries it has long dominated. Korea expanded its K-CHIPS Act to protect semiconductor leadership that underpins its export economy. India launched Production-Linked Incentive schemes exceeding $30 billion to capture manufacturing migrating from China.
Each nation fears falling behind in this subsidy race. The inevitable result: global overcapacity in subsidized sectors as every major economy builds parallel capacity, margin compression for producers who must compete against subsidized rivals, and consumer benefit from lower prices as overcapacity drives aggressive pricing.
Key Insight: Subsidy competition creates winners (consumers, early movers who capture credits before competition intensifies) and losers (late entrants facing overcapacity, unsubsidized producers competing against government-backed rivals). Position on the right side of this dynamic.
Localization Mandates
Subsidies increasingly require local content, a structural shift that forces supply chain reorganization. The IRA's EV credit exemplifies this trend: battery component thresholds ratchet from 50% domestic or allied-country content to 100% over the program's life, essentially mandating North American battery supply chains. The IRA solar bonus adds 10% to Investment Tax Credits for domestically manufactured equipment, creating decisive competitive advantage for local producers. Europe takes a different approach through the EU battery regulation, imposing carbon footprint reporting and recycling mandates that favor European producers with lower embedded emissions. India's Production-Linked Incentive (PLI) schemes establish domestic value addition thresholds that foreign manufacturers must meet to access subsidies.
Investment Implication: Supply chains must localize. Companies building multi-regional manufacturing capability gain flexibility. Pure exporters face access barriers.
Fiscal Sustainability Questions
The Cost Debate
Critics argue industrial policy costs exceed benefits, and the concerns have merit. The fiscal burden is substantial and growing: IRA costs now appear likely to exceed $1 trillion, far above the $369 billion headline figure, as uncapped tax credits attract more investment than projected. Inefficient allocation represents another genuine risk, as political factors inevitably influence project selection when government directs capital. Market distortion follows naturally: winners are determined by policy compliance rather than competitive merit, potentially protecting inefficient producers. Trade retaliation compounds these costs as partners respond with their own subsidies, triggering an escalation cycle.
Counterargument: The relevant comparison is not free markets vs. industrial policy. It is: what happens if the US doesn't match Chinese state capitalism? Ceding strategic industries carries long-term costs exceeding subsidy expense.
Political Economy of Continuation
Industrial policy creates constituencies for its continuation that make phase-out politically difficult. Workers whose jobs depend on subsidized industries vote and organize against subsidy elimination. Regions whose local economies have been rebuilt around policy-supported factories lobby aggressively for continuation, often with bipartisan local support. Companies whose business models are predicated on continued support invest in political relationships that protect their interests. Politicians who claim credit for job creation and investment announcements have no incentive to reverse policies that deliver visible benefits.
These constituencies resist phase-out with remarkable effectiveness. Once established, industrial policy tends toward permanence regardless of whether the original rationale remains valid.
Investment Implications
Framework for Subsidy Investing
Evaluating subsidy-dependent investments requires assessing several key factors. Policy duration matters most: favor companies benefiting from programs legislated through 2030 or beyond over those dependent on annual appropriations vulnerable to political winds. Local content positioning separates winners from losers, as domestic producers capture full subsidies while import-dependent competitors face access barriers. Technology stage affects execution risk: proven technologies scaling rapidly offer better risk-adjusted returns than pre-commercial bets awaiting technical validation. Competitive dynamics determine margin capture: limited entrants can price to capture subsidy value while overcrowded sectors see subsidies competed away through lower prices. Political support provides durability insurance: programs with bipartisan backing survive administration changes while partisan initiatives face reversal risk.
Sector Allocations
Overweight positioning captures the clearest policy beneficiaries. Renewable energy manufacturing across solar, wind, and batteries enjoys IRA tax credits that transform project economics. Grid infrastructure and storage addresses the bottleneck constraining renewable deployment, where policy support meets genuine demand. Semiconductor equipment captures spending across all policy-driven capacity additions regardless of which fab projects succeed. Industrial automation benefits as factory productivity becomes essential for competing in higher-wage reshored manufacturing. Green hydrogen pure plays capture perhaps the most transformative subsidy, as the $3/kg production tax credit essentially creates an industry from scratch.
Selective positioning applies to sectors with mixed dynamics. EV manufacturers benefit from demand-side incentives but face margin pressure from intensifying competition as every automaker accelerates electrification. Traditional utilities are clear beneficiaries of grid investment but execution capability varies dramatically, and some will capture the opportunity while others stumble. Mining and materials offer exposure to input scarcity but resource nationalism complicates the thesis, adding political risk to geological uncertainty.
Underweight positioning reflects structural disadvantages. Unsubsidized commodity producers compete against rivals receiving state support without receiving any themselves. Carbon-intensive exporters face CBAM penalties that grow progressively more burdensome as the mechanism phases in. Import-reliant manufacturing finds itself on the wrong side of every localization mandate.
Regional Positioning
United States: Maximum exposure to IRA/CHIPS beneficiaries. Policy support is broadest and most durable.
Europe: Selective exposure to CBAM-protected industrials. Green steel, low-carbon materials.
Asia: Access through equipment and materials suppliers rather than direct manufacturing (exposed to overcapacity).
Conclusion: Investing in State Capitalism
The return of industrial policy is not a policy debate; it is an investment reality. Governments are directing capital flows at unprecedented scale. Fighting this tide is futile; profiting from it is possible.

The winning approach combines four analytical steps. First, identify policy beneficiaries by asking which sectors receive durable, substantial support, not just headline programs but credits with decade-long horizons and bipartisan constituencies. Second, assess competitive dynamics to determine whether support creates sustainable moats or merely overcapacity that competes away margins. Third, evaluate execution capability: can specific companies capture subsidies effectively, or will implementation challenges prevent benefit realization? Fourth, monitor sustainability by tracking whether political support will persist through administration changes and fiscal pressures.
Industrial policy creates winners by design. Position portfolios to capture those winners while avoiding sectors crushed by subsidized competition they cannot match.
The next decade will not be defined by free market outcomes. It will be defined by policy-shaped outcomes. Invest accordingly.
Series Navigation
This article is part of our comprehensive Modern Mercantilism research series:
- Modern Mercantilism: The Investment Thesis
- Technology & AI Sovereignty
- Resource Nationalism
- Financial Fragmentation
- Industrial Subsidies & State Capitalism (Current)
- Trade Realignment & Bloc Formation
- Investment Implications & Portfolio Positioning