
Introduction: The End of Borderless Trade
Global trade peaked in 2008 as a share of GDP. Since then, a series of shocks including financial crisis, trade wars, pandemic, and sanctions have progressively weakened the case for hyper-globalized supply chains.
Global Trade Openness: The Rollover
| Year | Trade as % of GDP | Context |
|---|---|---|
| 2008 | 61.0% | Peak globalization |
| 2015 | 56.8% | Post-GFC normalization |
| 2020 | 51.6% | Pandemic shock |
| 2023 | 56.3% | Partial recovery |
| 2030 (proj.) | 52-55% | Structural decline |
This 6-percentage-point reversal represents approximately $6 trillion in annual trade flows shifting from global to regional or domestic channels. The inflection point aligns perfectly with the debt-constraint channel described in our framework: the 2008 crisis pushed major economies over critical leverage thresholds, triggering the protectionist cascade that continues today.
The response is not deglobalization but reglobalization: trade continues, but routes reorganize around geopolitical alignment rather than pure cost efficiency.
Key Takeaways
- Reglobalization, not deglobalization: Trade is rerouting rather than disappearing—$6 trillion in annual flows shifting from global to regional channels
- Mexico's ascendance: Already America's largest trading partner with 85% probability confirmed, industrial real estate premiums exceeding 30% by 2027
- Selective US-China decoupling: Strategic sectors (semiconductors, AI) face 75% probability of complete separation; consumer goods trade continues
- Vietnam matures, Indonesia rises: Vietnam faces trade surplus scrutiny; Indonesia positioned to capture next wave of manufacturing relocation
- India remains high-potential, high-risk: Enormous opportunity constrained by infrastructure gaps, bureaucracy, and protectionist instincts
- Resilience premium: Companies accepting 10-25% higher costs for near-shoring and dual sourcing to reduce supply chain vulnerability
The numbers tell the story:
| Metric | Pre-2018 | Current | Trend |
|---|---|---|---|
| US-China trade | $660B | $575B | Declining |
| Mexico-US trade | $580B | $780B | Rising sharply |
| Vietnam-US trade | $60B | $140B | Rising sharply |
| Intra-ASEAN trade | $280B | $380B | Rising |
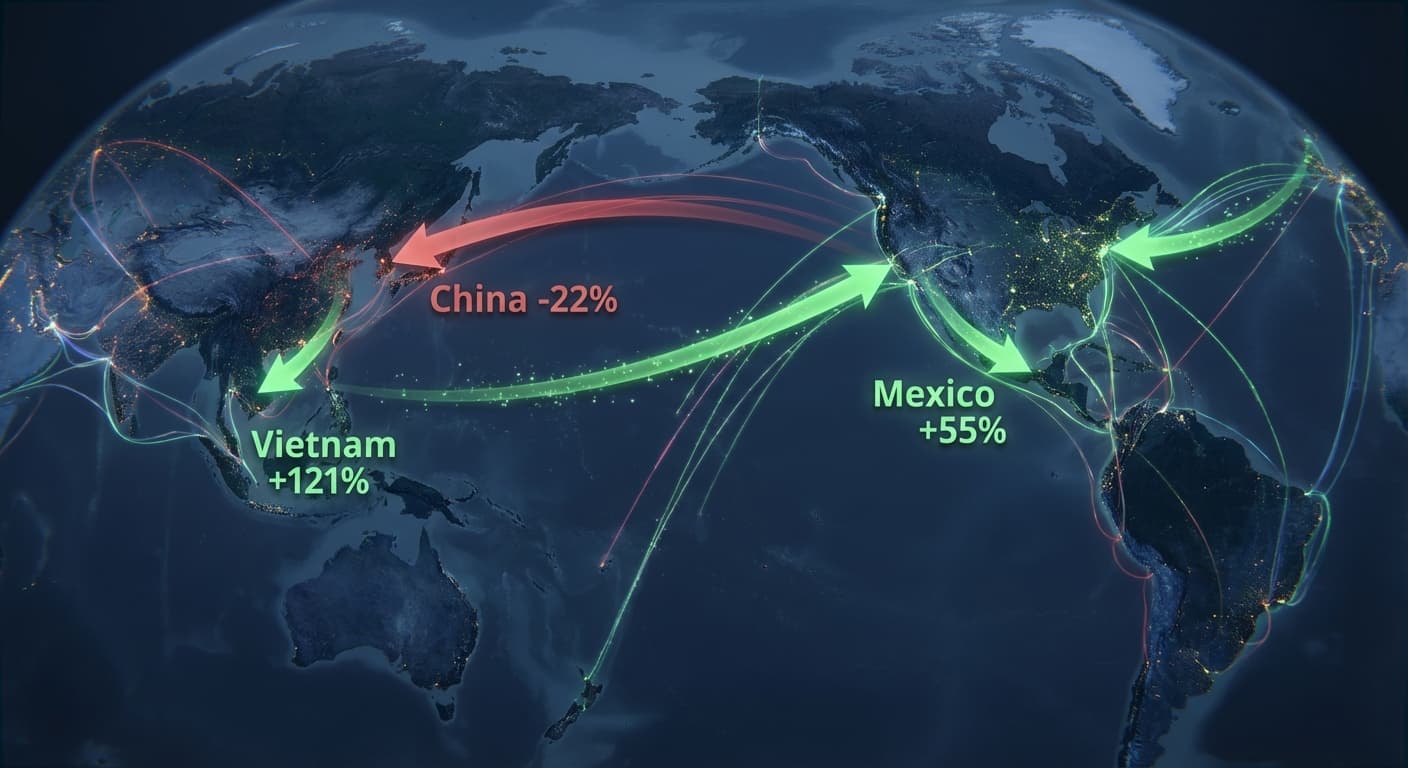
Trade is not disappearing; it is rerouting.
The Friend-Shoring Paradigm
What is Friend-Shoring?
Friend-shoring redirects supply chains toward geopolitically aligned partners, driven by a clear strategic logic. Security demands that critical supplies not depend on potential adversaries who might weaponize access during disputes. Resilience requires a diversified supplier base that reduces single-point-of-failure risk across geographies. Values alignment favors trade with countries sharing governance standards, labor practices, and environmental commitments. Political sustainability recognizes that domestic politics increasingly demand reduced dependence on rivals, as voters notice when critical supplies flow from adversary nations.
The Friend-Shore Hierarchy
Not all "friends" are equal. A clear hierarchy emerges in how supply chains reorganize around geopolitical alignment.
Tier 1: Core Alliance countries (United States, United Kingdom, Canada, Australia, Japan) enjoy minimal trade friction. Security cooperation, intelligence sharing, and deep economic integration make these relationships foundation-level. Supply chain trust is assumed.
Tier 2: Strong Alignment partners (European Union, South Korea, Taiwan, Singapore) experience low friction despite occasional tensions. These nations share democratic governance, market economies, and security cooperation. Trade flows freely with manageable compliance burdens.
Tier 3: Pragmatic Partners (India, Mexico, Vietnam, Indonesia) represent the sweet spot for supply chain migration. These countries offer meaningful cost advantages over Tier 1-2 while maintaining acceptable political alignment. Moderate friction exists (regulatory complexity, corruption, infrastructure gaps) but the economics work.
Tier 4: Transactional relationships (Turkey, Saudi Arabia, UAE) feature variable friction depending on specific circumstances. These partners offer strategic value without ideological alignment. Trade continues but with heightened scrutiny and relationship-specific considerations.
Adversary nations (China, Russia, Iran) face high to prohibitive friction. Strategic sectors are essentially closed; other trade continues under significant restrictions and delisting risk.
Investment Implication: Tier 2-3 countries capture supply chain migration. They offer cost advantages over Tier 1 with acceptable political alignment. Mexico, Vietnam, and India are primary beneficiaries.
Key Forecasts: Trade Realignment
US-China Decoupling
Our forecasts reveal a bifurcated decoupling trajectory. We assign 50% probability that total US-China trade falls below $500 billion by 2028, a significant decline from the $575 billion current level but far from zero. Strategic sectors face near-complete separation: we give 75% probability to complete semiconductor decoupling by 2027, reflecting the inexorable logic of technology denial policies. Yet consumer goods present a different picture, with 65% probability that this category's decoupling remains limited through 2030, as cost realities and supply chain inertia preserve substantial trade flows. Chinese tech companies face meaningful delisting risk: 55% probability of forced exit from US exchanges by 2028 as audit access requirements remain unresolved.
Analysis: US-China decoupling is selective, not total. Strategic sectors (semiconductors, AI, quantum, biotech) face near-complete separation. Consumer goods continue; Americans still buy Chinese-made products, and this is unlikely to change given cost realities.
The "small yard, high fence" approach defines clear boundaries. Inside the fence (subject to comprehensive restrictions) are semiconductors, AI chips, defense technology, and quantum computing. These represent the technologies that determine military advantage and economic dominance; they face near-total separation. Outside the fence, continuing with manageable friction, are consumer electronics, textiles, furniture, and general manufacturing. The logic is straightforward: America still buys Chinese-made products because the economics are compelling and the security implications minimal.
Investment Implication: Position for strategic sector separation while recognizing consumer goods trade continues. Semiconductor supply chains restructure entirely; apparel supply chains adjust gradually.
Mexico: The Near-Shore Winner
Mexico has already claimed the prize: with 85% probability (essentially certainty), it has become the largest US trading partner; this has already occurred. The second-order effects are now playing out. We assign 70% probability that industrial real estate premiums in Northern Mexico exceed 30% by 2027 as capacity constraints bind against surging demand. Mexican manufacturing wages face 60% odds of rising 40% or more by 2030, as success brings its own challenges as labor markets tighten. The ultimate question: can Mexico capture sustained share of diverted China trade? We give 50% probability that Mexico captures 20% or more of redirected flows by 2030, substantial but not guaranteed given infrastructure and security constraints.
Analysis: Mexico's advantages are structural rather than temporary. USMCA protection provides tariff-free access to the US market with rules of origin that actively favor regional production; this is codified trade preference, not discretionary policy. Geographic proximity transforms logistics economics: trucking goods across the border takes days compared to weeks for trans-Pacific shipping, enabling just-in-time manufacturing that ocean freight cannot support. Labor costs of $4-5 per hour compare favorably to $15+ in the US, though rising wages signal success rather than failure. Time zone alignment enables real-time collaboration with US operations, as engineers in Detroit and Monterrey work simultaneous schedules. Mexico's demographic dividend provides a median age of 29 versus 38 in the United States and 39 in China, offering decades of workforce growth.
Constraints exist: energy infrastructure strains under new demand, water scarcity limits northern expansion, security concerns persist in some regions, and skilled labor supply struggles to match capacity growth. But the fundamental proposition, near-shore manufacturing with cost advantage and trade protection, remains powerful.
Investment Implication: Northern Mexico industrial real estate, logistics infrastructure, and Mexican industrials benefit. FEMSA, Grupo Mexico, and industrial REITs capture nearshoring tailwinds.
Vietnam and Southeast Asia
Vietnam's trajectory shows both opportunity and constraint. We assign 65% probability that Vietnamese exports to the US exceed $150 billion by 2028, continued growth from the current $140 billion base. But success breeds scrutiny: 45% probability that Vietnam's ballooning trade surplus (now $105 billion with the US alone) triggers American trade action by 2027. The broader ASEAN story remains bullish longer-term, with 40% odds that the bloc becomes the largest trading grouping by volume by 2035 as Asian integration deepens. Indonesia represents the next frontier: we give 35% probability that it captures 10% or more of relocated manufacturing by 2030, lower odds reflecting execution challenges but enormous potential if infrastructure investments materialize.
Analysis: Vietnam has been the primary China+1 destination for manufacturing relocation. Samsung, Apple suppliers, and numerous multinationals have established operations. However, Vietnam's success creates its own constraints. Labor tightness means skilled manufacturing workers are increasingly scarce in industrial clusters, and companies compete for a finite pool of trained workers. Wage inflation follows naturally, with manufacturing wages rising 8-10% annually as demand exceeds supply. Infrastructure limits manifest in ports and power generation struggling to keep pace with industrial expansion, and blackouts and shipping delays remind companies that growth has boundaries. US scrutiny of Vietnam's $105 billion trade surplus with America invites tariff risk that could materialize suddenly.
The next wave of relocation flows to Indonesia, Malaysia, and eventually India.
Investment Implication: Vietnam is late-cycle; rotation toward Indonesia and broader ASEAN warranted. Infrastructure plays (ports, power, logistics) in emerging ASEAN destinations.
India: The Unrealized Opportunity
India's forecasts reveal the gap between potential and probability. We assign only 35% odds that manufacturing exceeds 20% of GDP by 2030, as the "Make in India" promise remains largely unfulfilled. But specific success stories show what's possible: 60% probability that Apple India production exceeds 25% of total iPhone output by 2028, as the company's concentrated execution proves India can work for determined multinationals. Broader trade expansion carries moderate odds, with 45% probability that India-US trade exceeds $250 billion by 2030. Most telling: just 25% probability that India joins RCEP or any similar comprehensive trade bloc by 2030, reflecting deep-seated protectionist instincts that limit integration despite strategic opportunity.
Analysis: India presents the largest opportunity and largest execution risk in supply chain realignment. The opportunity is genuinely compelling: demographic scale of 1.4 billion people with a median age of 28 provides workforce depth that no other democracy can match. Democratic alignment makes India the preferred partner for companies and governments seeking alternatives to authoritarian suppliers. A growing middle class creates domestic consumption opportunity that adds to the export manufacturing thesis. English language proficiency eases integration with Western operations in ways that Vietnam and Indonesia cannot replicate.
The constraints are equally real. Infrastructure gaps mean roads, ports, and power remain unreliable in many regions, and logistics costs reflect these deficiencies. Bureaucratic complexity creates regulatory burden that deters investment; what should take weeks takes months. Protectionist instincts run deep in Indian policymaking, and the country consistently resists comprehensive trade agreements that would lock in liberalization. State-level variation in land and labor laws creates complexity that frustrates companies seeking uniform national operations.
Investment Implication: Selective India exposure through proven operators. Companies with demonstrated India execution capability (Apple suppliers who have navigated the challenges, automotive multinationals with established operations) deserve preference over broad India bets that assume improvement in factors that have resisted change for decades.
The Bloc Trade Architecture
Emerging Trade Blocs
Global trade is organizing into overlapping blocs, each with distinct economic weight and strategic orientation.
USMCA unites the United States, Mexico, and Canada into a $30 trillion bloc focused on North American integration. This represents the most deeply integrated trading relationship globally, with rules of origin requirements actively reshaping supply chains toward regional sourcing.
The European Union Single Market brings 27 members together in an $18 trillion economy pursuing ever-deeper European integration. Regulatory harmonization and the single currency create genuine market unity despite political fragmentation.
RCEP (the Regional Comprehensive Economic Partnership) assembles 15 Asia-Pacific nations representing $28 trillion in combined GDP. China's inclusion makes this the default Asian trading architecture, though its practical impact remains modest given existing bilateral agreements.
CPTPP (the Comprehensive and Progressive Trans-Pacific Partnership) groups 11 Pacific nations in a $12 trillion bloc pursuing Pacific integration, notably excluding both the United States and China. Its strategic value diminished without American participation but trade facilitation benefits remain.
The African Continental Free Trade Area represents the most ambitious but nascent project, bringing 54 African nations into a $3 trillion combined economy. Full implementation remains distant but the framework for continental integration now exists.
Bloc Dynamics
USMCA (North America)
The USMCA represents the most integrated trade bloc. Rules of origin requirements (75% regional content for auto tariff-free status) are driving supply chain regionalization. The 2026 review creates uncertainty but fundamental incentives favor deeper integration.
RCEP (Asia-Pacific)
RCEP is the world's largest trade bloc by population and GDP. China's inclusion makes it the default Asian trading architecture. However, RCEP's value-add over existing bilateral agreements is modest. Its significance is primarily symbolic: Asian economic integration proceeds with or without US participation.
CPTPP (Comprehensive and Progressive Trans-Pacific Partnership)
The CPTPP represents what the TPP could have been. Without US participation, its strategic value is limited, but trade facilitation benefits remain. China's application to join would transform bloc dynamics, and current members are divided on admission.
Implications of Bloc Formation
The bloc architecture creates four structural pressures that reshape corporate strategy.
Rules of origin force supply chain regionalization: to qualify for tariff-free treatment, companies must source specified percentages of content from within bloc boundaries. This is not a suggestion; it's a compliance requirement that determines competitive positioning.
Regulatory harmonization drives standards convergence within blocs. Companies standardizing on bloc-specific regulations gain efficiency; those managing multiple regimes bear costs. Over time, intra-bloc trade becomes easier while extra-bloc trade grows more complex.
Tariff differentials create explicit disadvantages for extra-bloc trade. As blocs deepen integration internally while maintaining or raising external barriers, the gap between insider and outsider economics widens.
Investment flows follow trade access with remarkable consistency. Foreign direct investment concentrates in locations offering preferential access to target markets. Bloc membership becomes a determinant of FDI attractiveness.
Investment Implication: Companies operating across bloc boundaries face complexity costs. Pure-play regional champions with bloc-optimized operations gain advantage over global operators managing multiple regulatory regimes.
Supply Chain Restructuring
The Resilience Premium
Companies are accepting higher costs for supply chain resilience, a fundamental shift from the efficiency-at-all-costs mindset of peak globalization.
Dual sourcing adds 5-15% to costs but delivers high resilience gains. Having qualified alternate suppliers transforms single-point-of-failure risk into manageable redundancy. The setup cost is significant; the insurance value is substantial.
Near-shoring carries a steeper 10-25% cost premium but similarly high resilience benefits. Moving production closer to demand reduces transit time, tariff exposure, and geopolitical risk. The math increasingly works for medium-value goods where speed and reliability matter.
Safety stock offers a more modest tradeoff: 3-8% cost increase for moderate resilience improvement. Inventory buffers smooth supply disruptions but cannot address systemic failures. This is a complement to, not substitute for, structural supply chain changes.
Vertical integration represents the ultimate resilience play at 15-30% cost premium and delivers the highest protection. Owning critical supply chain nodes eliminates dependence on external parties. Tesla's move into battery production exemplifies the logic.
The willingness to pay these premiums reflects hard lessons from COVID disruptions, geopolitical shocks, and customer demands for supply security.
Sector-Specific Restructuring
Semiconductors
The most dramatic restructuring. Intel, TSMC, and Samsung are building fabs in US, Europe, and Japan. Timeline: 3-5 years for new capacity. Cost: 30-50% higher than Asian production. Rationale: national security trumps cost.
Automotive
EV transition accelerates supply chain restructuring. Battery supply chains reorganizing around IRA requirements (North American content) and European regulations. ICE supply chains continue optimizing for cost.
Consumer Electronics
Gradual diversification from China. Vietnam, India, and Mexico gain share. Complete relocation impractical given China's ecosystem depth. Hybrid strategies dominate: final assembly diversified, component production remains concentrated.
Pharmaceuticals
Active pharmaceutical ingredient (API) supply chains remain China/India concentrated. Reshoring proves difficult given cost differentials and regulatory complexity. Partial diversification underway but comprehensive restructuring distant.
Investment Implications
Geographic Winners
The trade realignment creates clear geographic winners with distinct investment approaches for each.
Mexico leads as the nearshoring champion, benefiting from proximity to the world's largest consumer market. Investment vehicles include industrial REITs capturing manufacturing facility demand, port operators handling increased cargo volumes, and logistics companies enabling just-in-time delivery across the border.
Vietnam represents the mature China+1 story, already well-established as a manufacturing alternative. Access through listed Vietnamese industrials or Vietnam-focused ETFs provides exposure, though late-cycle positioning warrants selectivity.
Indonesia embodies the emerging China+1 opportunity with greater upside and execution risk. Infrastructure plays (ports, power generation, transportation) and banks financing expansion capture the opportunity as it develops.
India remains a long-term option with enormous potential constrained by execution challenges. Invest through selective multinationals with demonstrated India operating capability rather than broad India bets.
Poland serves as the European nearshore equivalent of Mexico, capturing manufacturing and logistics migrating from higher-cost Western Europe. Logistics operators and manufacturing facilities benefit from its strategic position.
Geographic Losers
Trade realignment creates losers alongside winners, exposures to avoid or reduce.
China faces the dual challenge of decoupling from Western markets and domestic overcapacity in key sectors. Avoid export-dependent Chinese manufacturers facing both tariff barriers and margin compression from oversupply.
Taiwan carries concentrated geopolitical risk that markets periodically price but never resolve. Non-diversified suppliers (those without mainland or alternative production) face existential exposure to cross-strait tensions. Diversification is essential.
Germany confronts structural headwinds from elevated energy costs post-Russia and deep exposure to the slowing Chinese market. German auto suppliers face particular pressure as the industry transformation accelerates amid margin compression.
The United Kingdom continues paying the Brexit friction tax. Manufacturing operations face tariff barriers, customs delays, and regulatory divergence that erode competitiveness. Exposure to UK-based manufacturing warrants skepticism absent clear domestic market advantages.
Sector Positioning
The sector implications of trade realignment divide clearly into three categories.
Overweight positioning favors sectors that benefit directly from realignment dynamics. Logistics and transportation operators thrive because complexity creates opportunity: every new trade route requires shipping, trucking, and warehousing. Industrial real estate in nearshoring destinations captures the manufacturing facility demand that supply chain migration creates. Automation investments accelerate as companies mitigate labor costs in higher-wage locations. Trade compliance technology becomes essential infrastructure for navigating regulatory fragmentation. Regional retail and distribution networks gain importance as supply chains localize.
Selective positioning applies to sectors with mixed exposure. Multinationals with genuine supply chain flexibility can navigate realignment but require case-by-case analysis. Contract manufacturers with multi-region capability capture business from companies diversifying production, though competition intensifies. Commodity traders with geographic optionality can arbitrage between blocs, but the opportunity depends on specific relationships and capabilities.
Underweight positioning reflects structural headwinds. Pure-play China exporters face the dual challenge of tariff barriers and domestic overcapacity. Companies with concentrated supply chains carry unacceptable single-point-of-failure risk that investors increasingly penalize. Businesses dependent on cross-bloc arbitrage, profiting from regulatory or cost differences between competing blocs, face existential risk as those gaps either close or become inaccessible.
The Complexity Premium
Trade realignment creates operational complexity that commands a structural premium. Customs brokerage expertise becomes increasingly valuable as cross-border trade grows more technical, and knowing the rules creates real advantage. Trade finance requirements expand because working capital for longer, more complex supply chains exceeds what efficient just-in-time models required. Logistics optimization demands multi-modal, multi-route planning that maximizes efficiency within bloc constraints. Compliance technology handles rules of origin calculations, sanctions screening, and tariff optimization that manual processes cannot match at scale.
Investment Thesis: Complexity is the enemy of efficiency but the friend of specialized service providers. Invest in businesses that profit from the friction that deters less capable competitors.
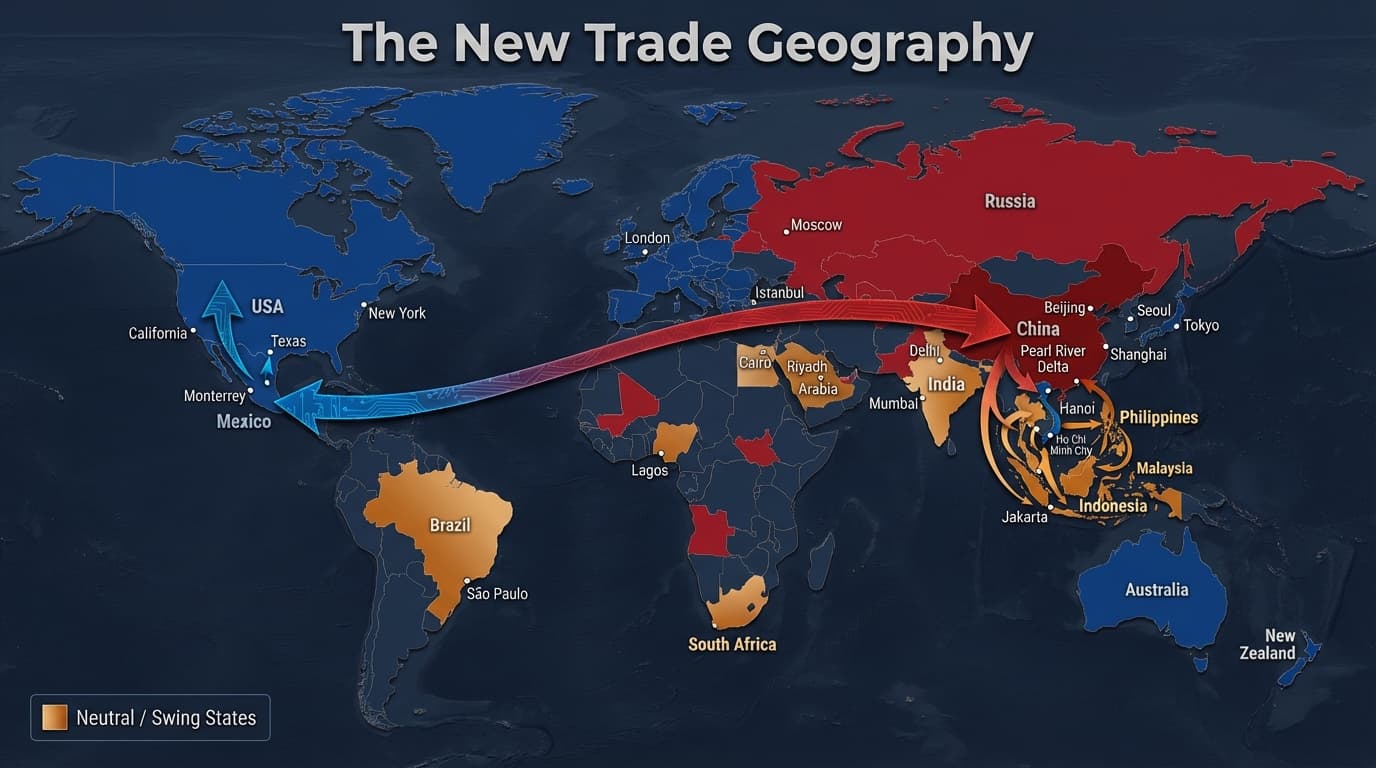
Conclusion: The New Trade Geography
Trade realignment is not a crisis; it is a transition with clear winners and losers. The winning position combines four essential elements.
Production must be located within target market blocs, with manufacturing capability that enjoys tariff-free access and regulatory alignment with customers. Supply chain flexibility requires multiple sourcing options across geopolitical scenarios, ensuring that no single disruption can halt operations. Compliance capability enables navigation of increasingly complex regulatory requirements that defeat less prepared competitors. And resilience must take precedence over pure efficiency, accepting higher costs for supply security that justifies premium pricing.
The global economy is not deglobalizing; it is reglobalizing along new lines. Capital, goods, and services continue flowing, but routes reshape around geopolitical alignment rather than pure cost optimization.
Investors who understand this transition and can identify the new trade geography before it fully materializes will capture structural opportunities. Position for the blocs that form, the corridors that emerge, and the complexity that rewards specialized capability.
The winners of the next decade will be those who manufacture where the demand is, source from aligned partners, and navigate the friction that deters less capable competitors.
Series Navigation
This article is part of our comprehensive Modern Mercantilism research series: