
The Uncomfortable Truth About LP Allocation to Emerging Markets
Let me start with a confession: I spent years on the GP side of the table watching LPs make the same mistakes, repeatedly. Not because they lacked intelligence or resources, but because their institutional frameworks were designed for a different reality. The Yale Model works beautifully when you have a 50-year time horizon, $40 billion in assets, and a board that trusts your judgment. It fails spectacularly when translated to a $500 million pension fund with quarterly reporting requirements and an investment committee that reads the Financial Times headlines.
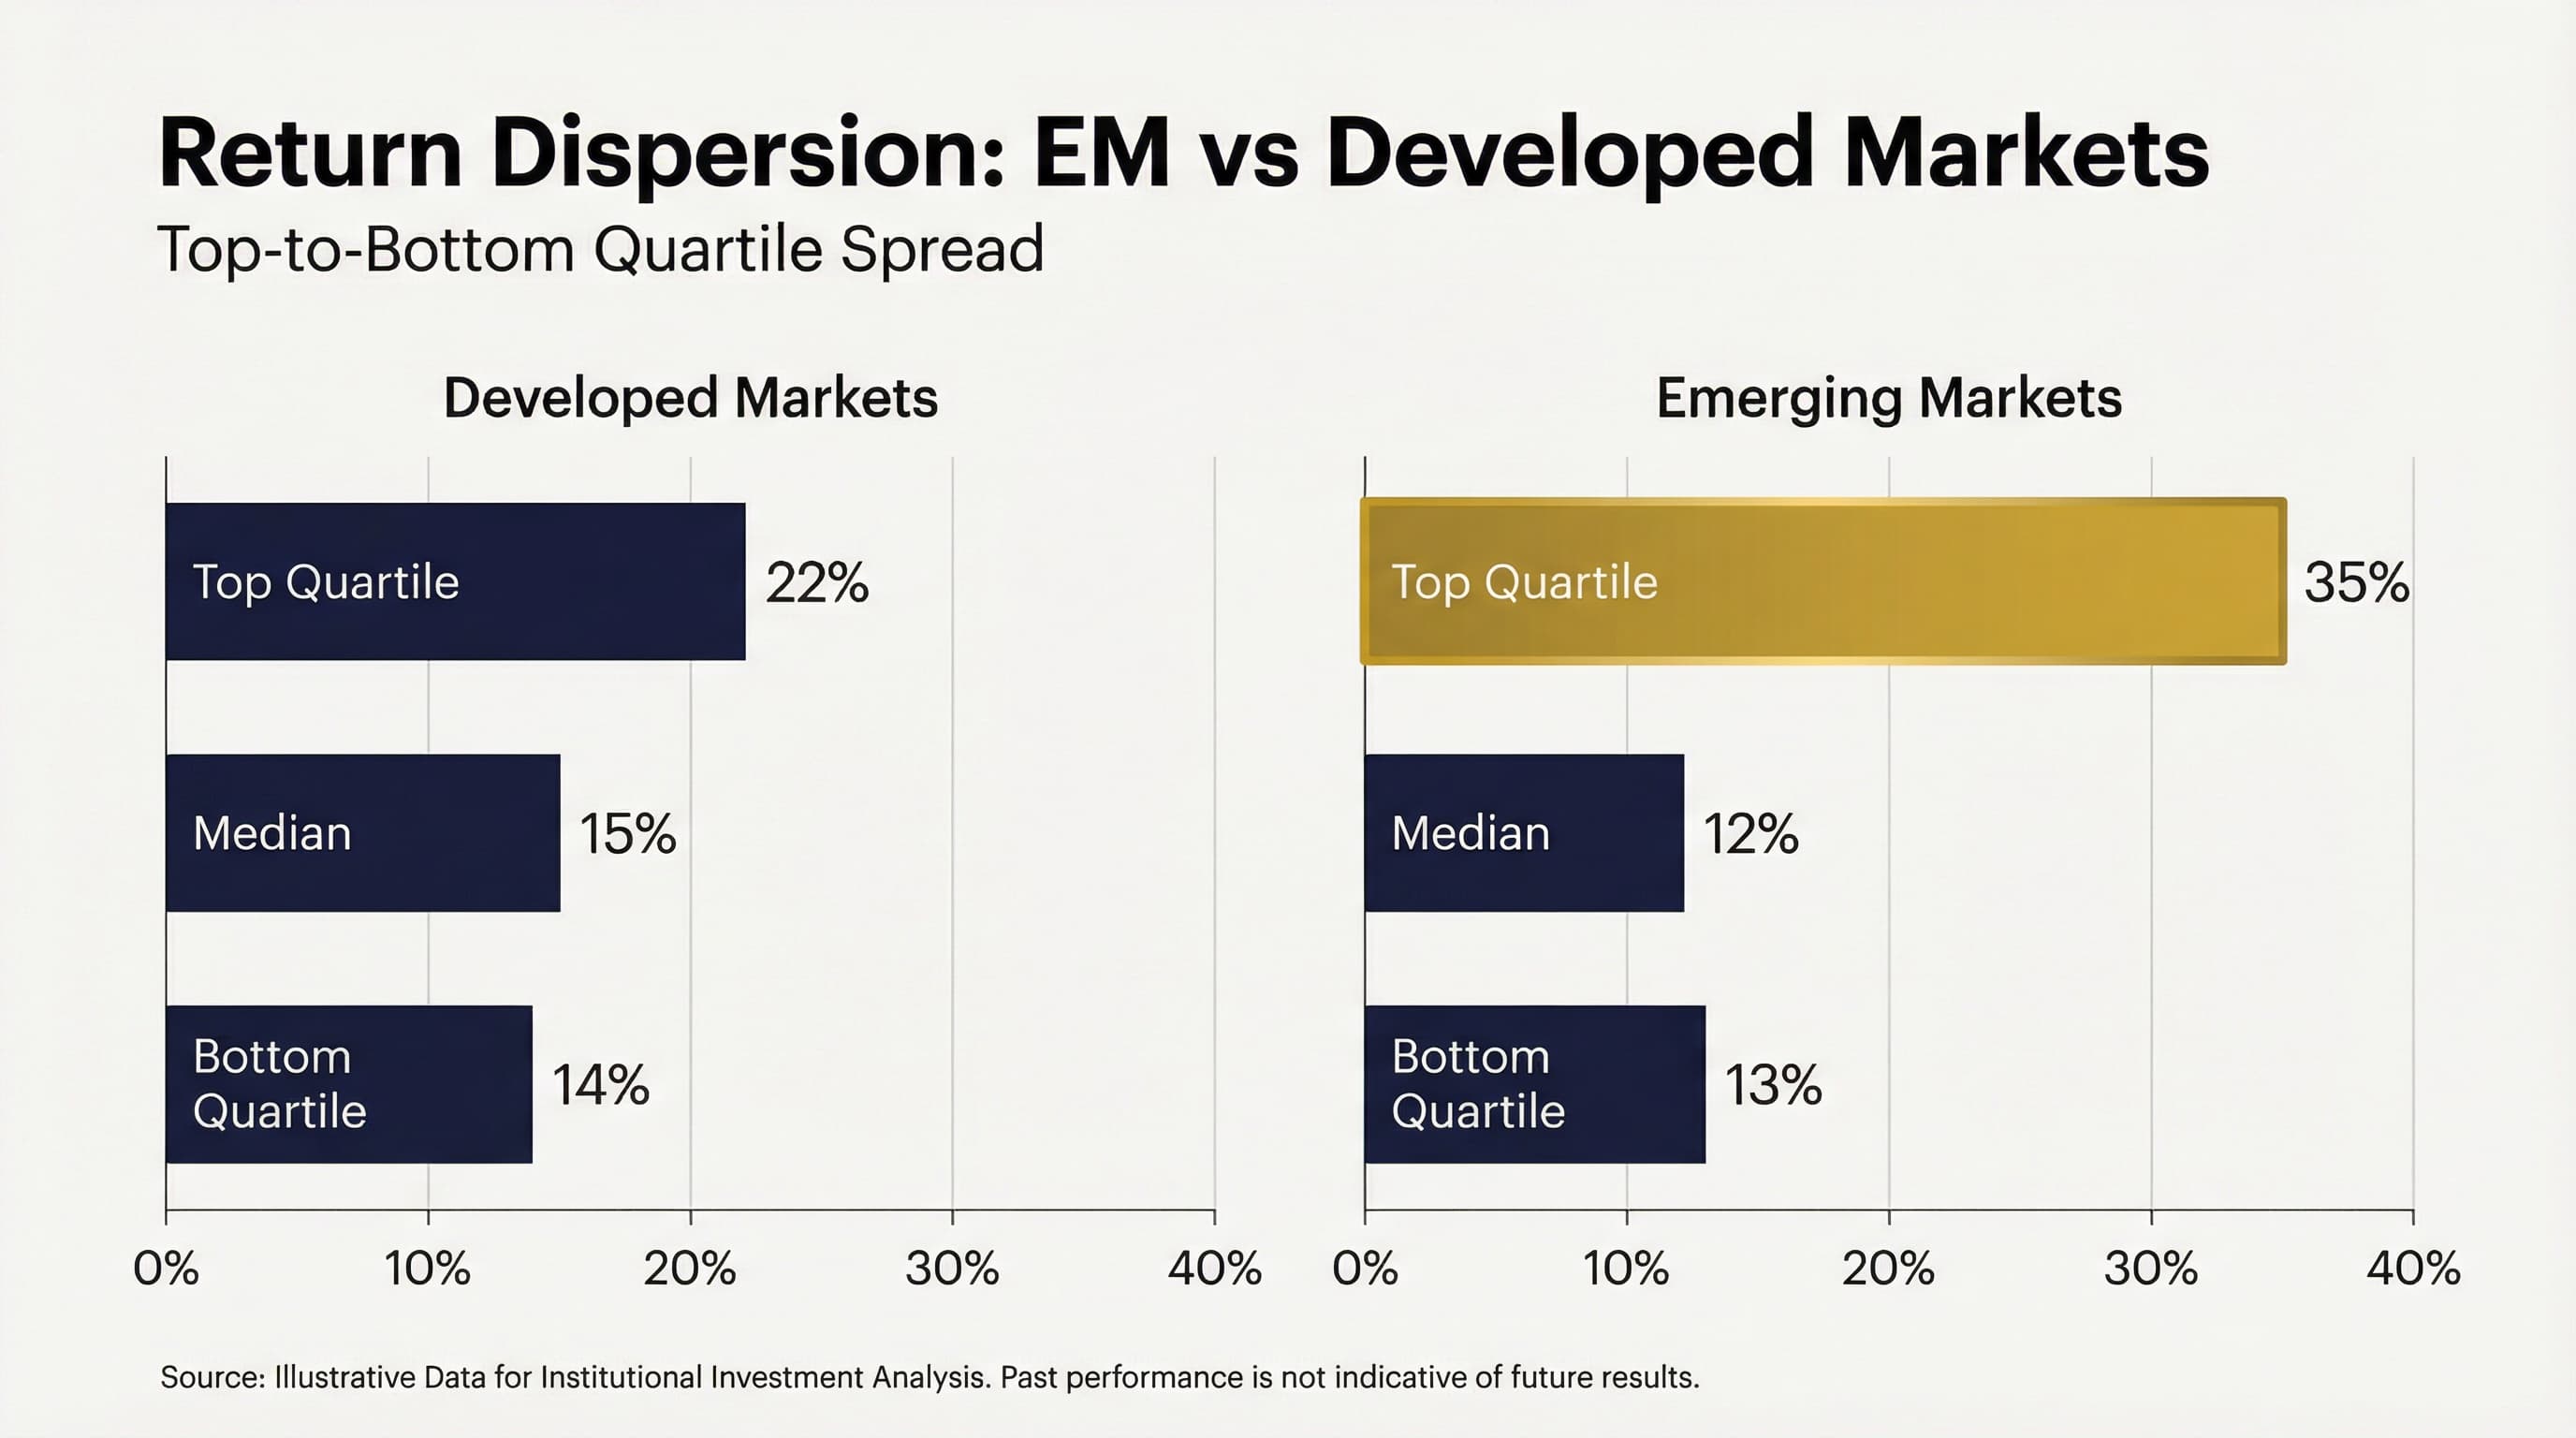
The data tells a damning story. According to Cambridge Associates' 2024 Emerging Markets PE/VC benchmark, the dispersion between top-quartile and bottom-quartile returns in emerging market private equity is nearly three times wider than in developed markets. In the US, the gap between top and bottom quartile is roughly 800 basis points. In emerging markets, it exceeds 2,200 basis points. This is not a market problem. It is a selection problem.
Key Takeaways
- Return dispersion: EM private equity shows 3x wider performance gap between top and bottom quartile GPs than developed markets
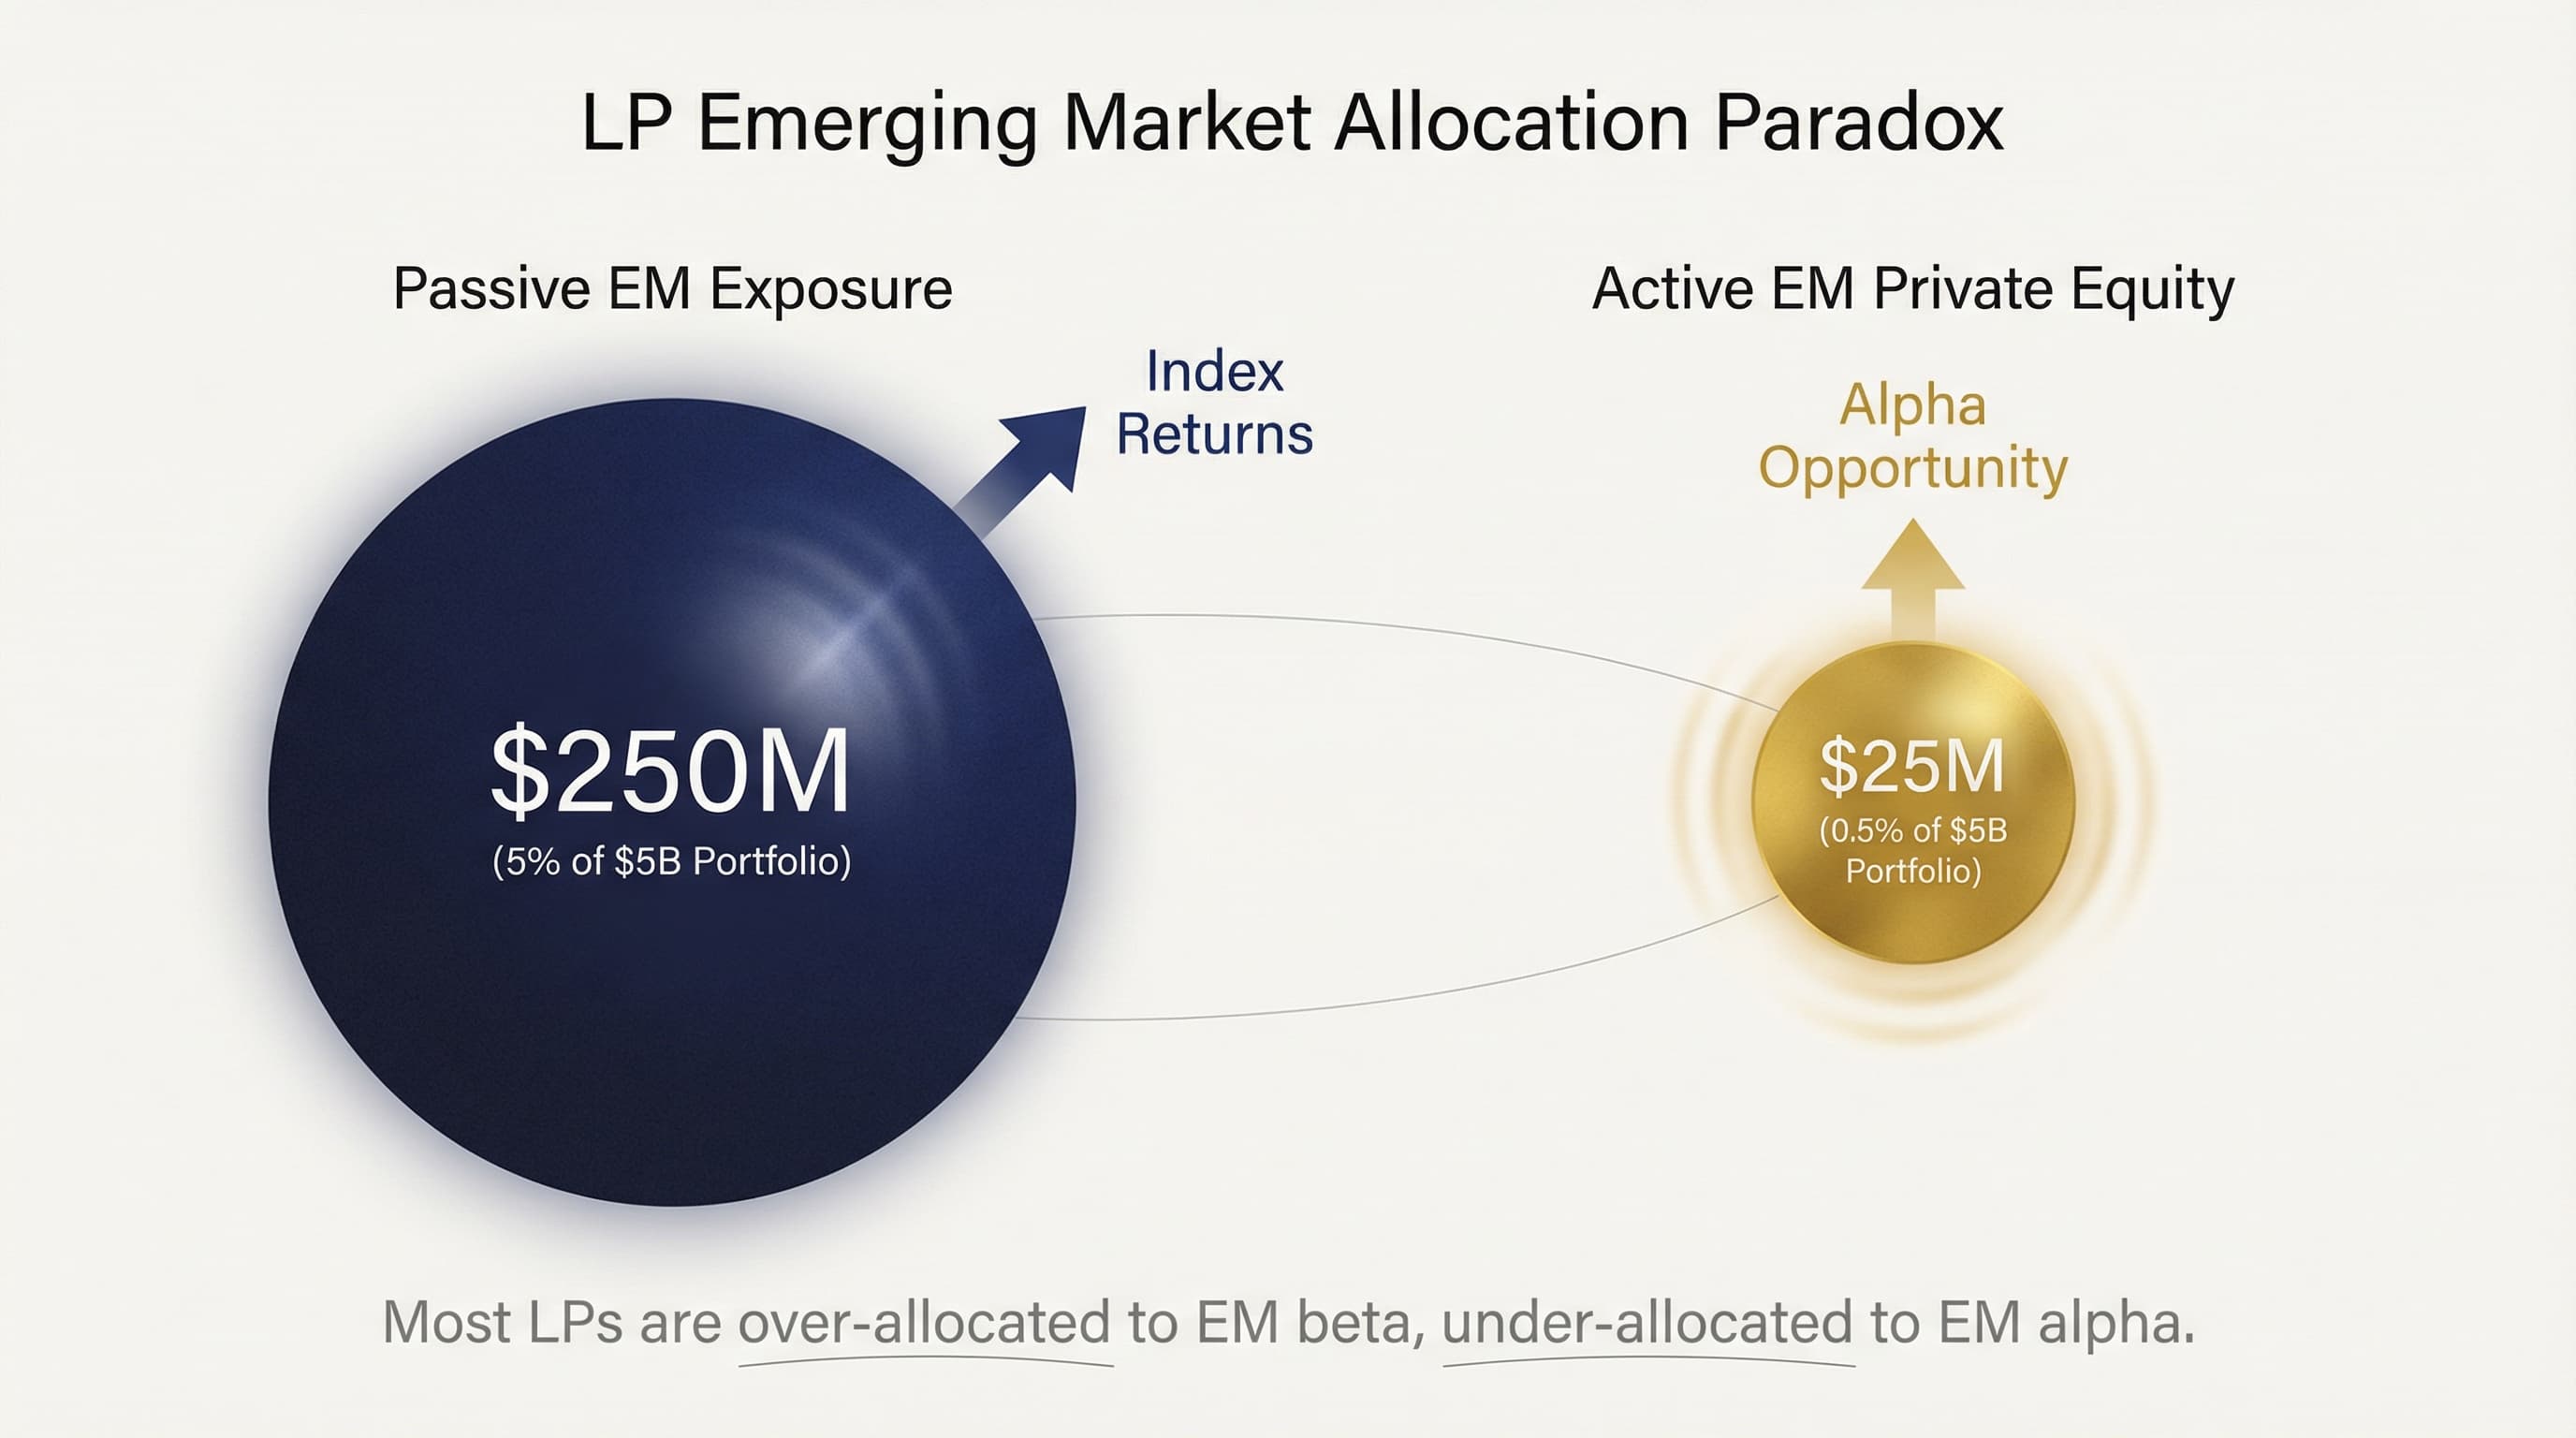
- Allocation paradox: Most LPs are simultaneously over-allocated to EM (by headline numbers) and under-allocated to quality EM managers
- Due diligence failure: Standard LP due diligence processes filter out the best EM managers while approving the mediocre
- Time horizon mismatch: Average LP hold period expectations (7-10 years) are incompatible with EM value creation cycles (10-15 years)
- Governance constraints: Investment committee structures designed for public markets create systematic disadvantages in EM allocation
- What works: The successful minority share specific characteristics that can be replicated
The Five Structural Failures
1. The Benchmark Trap
Most institutional investors benchmark their emerging market allocation against indices that bear no resemblance to what they can actually access. The MSCI Emerging Markets Index is dominated by liquid, large-cap public equities in China, Taiwan, and Korea. An LP allocating to African private equity or Southeast Asian venture capital and benchmarking against MSCI EM will either look like a genius or an idiot, with the outcome having almost nothing to do with manager selection.
According to McKinsey's Global Private Markets Report 2025, fundraising for emerging market private capital fell to its lowest level since 2016, even as LP surveys indicate continued interest. The gap between stated intention and actual allocation reveals the benchmark problem: when EM public markets underperform, LPs reduce private market allocations, even though the correlation between public and private EM returns is weak at best.
What the successful LPs do differently: They benchmark EM private equity against EM private equity, using vintage-year-appropriate peer comparisons. They evaluate African funds against African funds, not against a blended EM index. They accept that EM returns will be volatile on a mark-to-market basis and focus on realized multiples over full cycles.
2. The Due Diligence Paradox
Standard LP due diligence processes are designed to minimize headline risk, not maximize returns. The typical institutional due diligence questionnaire runs 200+ pages and asks questions that established, well-resourced GPs can answer easily, while filtering out the emerging managers who often generate the best returns.
Consider what happens when a $50 million African fund manager receives a DDQ from a $20 billion pension fund:
Questions that filter for size, not quality:
- "Please provide your audited financial statements for the past five years." (Many emerging managers are on Fund II or III and lack this history)
- "Please describe your ESG policy and dedicated ESG resources." (Smaller funds integrate ESG differently than those with dedicated teams)
- "Please provide three LP references from investors with over $50 billion in AUM." (Circular logic that excludes first-movers)
The Harvard Kennedy School's research on EM private equity return dispersion found that emerging managers in emerging markets generated statistically significant alpha relative to established players. Yet institutional due diligence processes systematically exclude them.
What the successful LPs do differently: They use due diligence to understand the manager, not to check boxes. They send principals, not associates. They conduct reference calls with local market participants, not just existing LPs. They evaluate operational capacity relative to fund size, not absolute headcount.
3. The Governance Gap
Most institutional investors have governance structures optimized for public markets. Investment committees meet quarterly. They review allocations across asset classes. They have limited capacity for deep dives on individual managers. This structure is reasonable when you are selecting from a universe of well-known public equity managers. It is catastrophic for emerging market private equity.
The Coller Capital Global Private Capital Barometer (Summer 2025) found that nearly a third of LPs reduced their private equity exposure in H1 2025, with emerging markets disproportionately affected. The stated reasons centered on liquidity concerns and the denominator effect. But the underlying cause was governance structures that could not distinguish between temporary mark-to-market volatility and fundamental value destruction.
Consider the timeline mismatch:
- Average investment committee meeting: 2-3 hours
- Number of items on typical agenda: 15-20
- Time available for emerging market discussion: 10-15 minutes
- Complexity of understanding a West African growth equity deal: Cannot be compressed into 15 minutes
What the successful LPs do differently: They create dedicated emerging market mandates with specialized governance. They empower smaller teams with sector expertise to make decisions within approved frameworks. They distinguish between strategic allocation reviews (annual) and tactical manager selection (ongoing). They accept that emerging markets require more governance attention per dollar deployed, and they resource accordingly.
4. The Currency Excuse
Currency volatility is the most cited reason for avoiding or reducing emerging market allocation. It is also the most misunderstood.
Yes, the Nigerian Naira depreciated roughly 70% against the USD between 2020 and 2025. Yes, this creates translation losses on interim valuations. But here is what the headlines miss: many of the best-performing EM funds in history operated during periods of currency volatility. The African venture funds of the 2010-2015 vintages generated exceptional dollar-denominated returns despite Naira weakness, because the underlying businesses grew faster than the currency depreciated.
According to the World Bank's research on long-run returns to private equity in emerging markets, currency effects wash out over sufficiently long holding periods for equity investments in growing businesses. The problem is not currency volatility. The problem is hold period expectations that are too short.
The currency objection reveals a deeper issue: LPs who cite currency risk are often looking for reasons to avoid EM, not genuinely analyzing the risk. If currency were the real concern, they would be overweight EM local currency debt (where you get paid to take currency risk) or dollarized economies. Instead, they avoid everything.
What the successful LPs do differently: They model currency scenarios explicitly, including both depreciation and appreciation. They understand that currency exposure can be managed through deal structuring (USD-linked pricing, offshore holding structures, natural hedges). They focus on real returns, not nominal local currency returns. Most importantly, they accept that emerging market private equity is a dollar-returnsdenominated asset class measured over 10+ year horizons.
5. The J-Curve Intolerance
Emerging market private equity funds typically have extended J-curves. Deployment periods are longer because deal sourcing is more relationship-intensive. Value creation takes more time because building infrastructure (literal and organizational) in emerging markets is harder than in developed markets. Exits take longer because secondary markets are less developed and strategic buyers have more leverage.
The AVCA 2024 African Private Capital Activity Report shows that African private equity hold periods average 5.8 years, compared to 4.5 years for global buyouts. But this understates the difference. The interquartile range is much wider, meaning some investments take 8-10+ years to exit properly.
LPs with standard 7-year portfolio models will see EM funds as underperforming based on interim IRRs, even when those funds are on track to generate strong final multiples. This creates pressure on GPs to exit early at suboptimal prices, which then generates the poor track records that LPs cite when reducing EM allocations. The cycle is self-reinforcing.
What the successful LPs do differently: They underwrite to TVPI (Total Value to Paid-In), not IRR. They evaluate GPs on exit quality, not exit speed. They structure LP advisory committee participation to provide long-term guidance rather than short-term pressure. They understand that an 18% IRR over 10 years is a better outcome than a 25% IRR over 5 years with residual value risk.
The Allocation Paradox: Over-Allocated and Under-Exposed
Here is the strange reality: many LPs are simultaneously over-allocated to emerging markets and under-exposed to quality EM managers.
The over-allocation comes from passive exposure through public markets. A 10% allocation to global equities includes significant EM public market exposure through index weights. Add in global bond funds with EM debt, and the headline EM number can look substantial.
The under-exposure comes from active allocations to private markets. Most LPs have minimal dedicated EM private equity allocations. When they do allocate, they often select the largest, most established managers who have the resources to navigate institutional due diligence but may not generate top-quartile returns.
According to Goldman Sachs' 2025 Private Markets Diagnostic Survey, LP allocations to private equity remained stable overall, but EM-focused funds captured a smaller share of commitments than their historical average. The capital that did flow to EM went disproportionately to mega-funds and continuation vehicles rather than emerging managers.
The math of this paradox:
An LP with $5 billion in assets might have:
- 5% EM public equity exposure = $250 million (passive, following an index)
- 0.5% EM private equity allocation = $25 million (active, highly concentrated)
The $250 million in passive exposure generates index returns. The $25 million in active allocation is too small to build a diversified program and too large for the LP to ignore. This is the worst of both worlds: meaningful EM exposure without meaningful EM alpha opportunity.
What the Successful Minority Does Differently
Having observed dozens of LP allocation decisions, I've identified patterns among the institutions that consistently generate strong EM returns. They share five characteristics:
1. They Treat EM as a Distinct Asset Class
Successful EM allocators do not run emerging market private equity through their main PE allocation. They create separate programs with dedicated teams, distinct governance, and specialized mandates. This is not just organizational hygiene. It is a recognition that EM requires different skills, relationships, and evaluation frameworks.
The Citi 2025 Global Family Office Report found that family offices with dedicated emerging market programs outperformed those who included EM within general alternative allocations. The difference was approximately 300 basis points annually over a 10-year period.
2. They Build Relationships Before They Invest
The best EM investments often come from managers who are not actively fundraising. By the time a manager has assembled the materials for an institutional roadshow, the smart money has already committed. Successful LPs maintain ongoing relationships with the EM ecosystem, not just with managers who are in market.
This requires resources that most institutions are unwilling to commit. It means sending investment professionals to emerging markets regularly, not just when evaluating a specific opportunity. It means attending local conferences, building relationships with local advisors, and understanding market dynamics in real time.
3. They Accept Smaller Absolute Allocations with Higher Conviction
A $10 billion pension fund cannot write a meaningful check to a $150 million African growth fund. But that $150 million fund might generate 3x multiples while the $2 billion global buyout fund generates 1.8x. Successful LPs accept that their EM programs will be smaller in absolute terms but higher in return contribution.
This requires a different definition of success. Rather than measuring program size, they measure program returns. Rather than counting the number of GP relationships, they measure the quality of those relationships. Rather than building diversified portfolios of mediocre managers, they build concentrated portfolios of exceptional ones.
4. They Align Time Horizons with Reality
The Cambridge Associates benchmarks show that EM private equity vintage-year returns improve significantly when measured over longer horizons. Funds that look poor at year 5 often look strong at year 10. Successful LPs build portfolio construction models that reflect this reality.
This means accepting that EM allocations will be in the J-curve longer. It means explaining to boards and beneficiaries that interim IRRs are not indicative of final outcomes. It means resisting pressure to redeem or reduce exposure during periods of EM volatility.
5. They Go Direct When Appropriate
Some of the best EM returns come from co-investments and direct investments alongside trusted GPs. Successful LPs build the capability to evaluate and execute these opportunities quickly. They do not rely solely on fund investments, which can only capture average GP returns.
The PwC Global Family Office Deals Study 2025 found that family offices with direct investment capabilities allocated 35% of their private market exposure through direct and co-investment structures, versus 15% for those without such capabilities. The return differential was meaningful.
The Governance Framework That Works
For LPs serious about EM allocation, here is a governance framework that accommodates the asset class's unique characteristics:
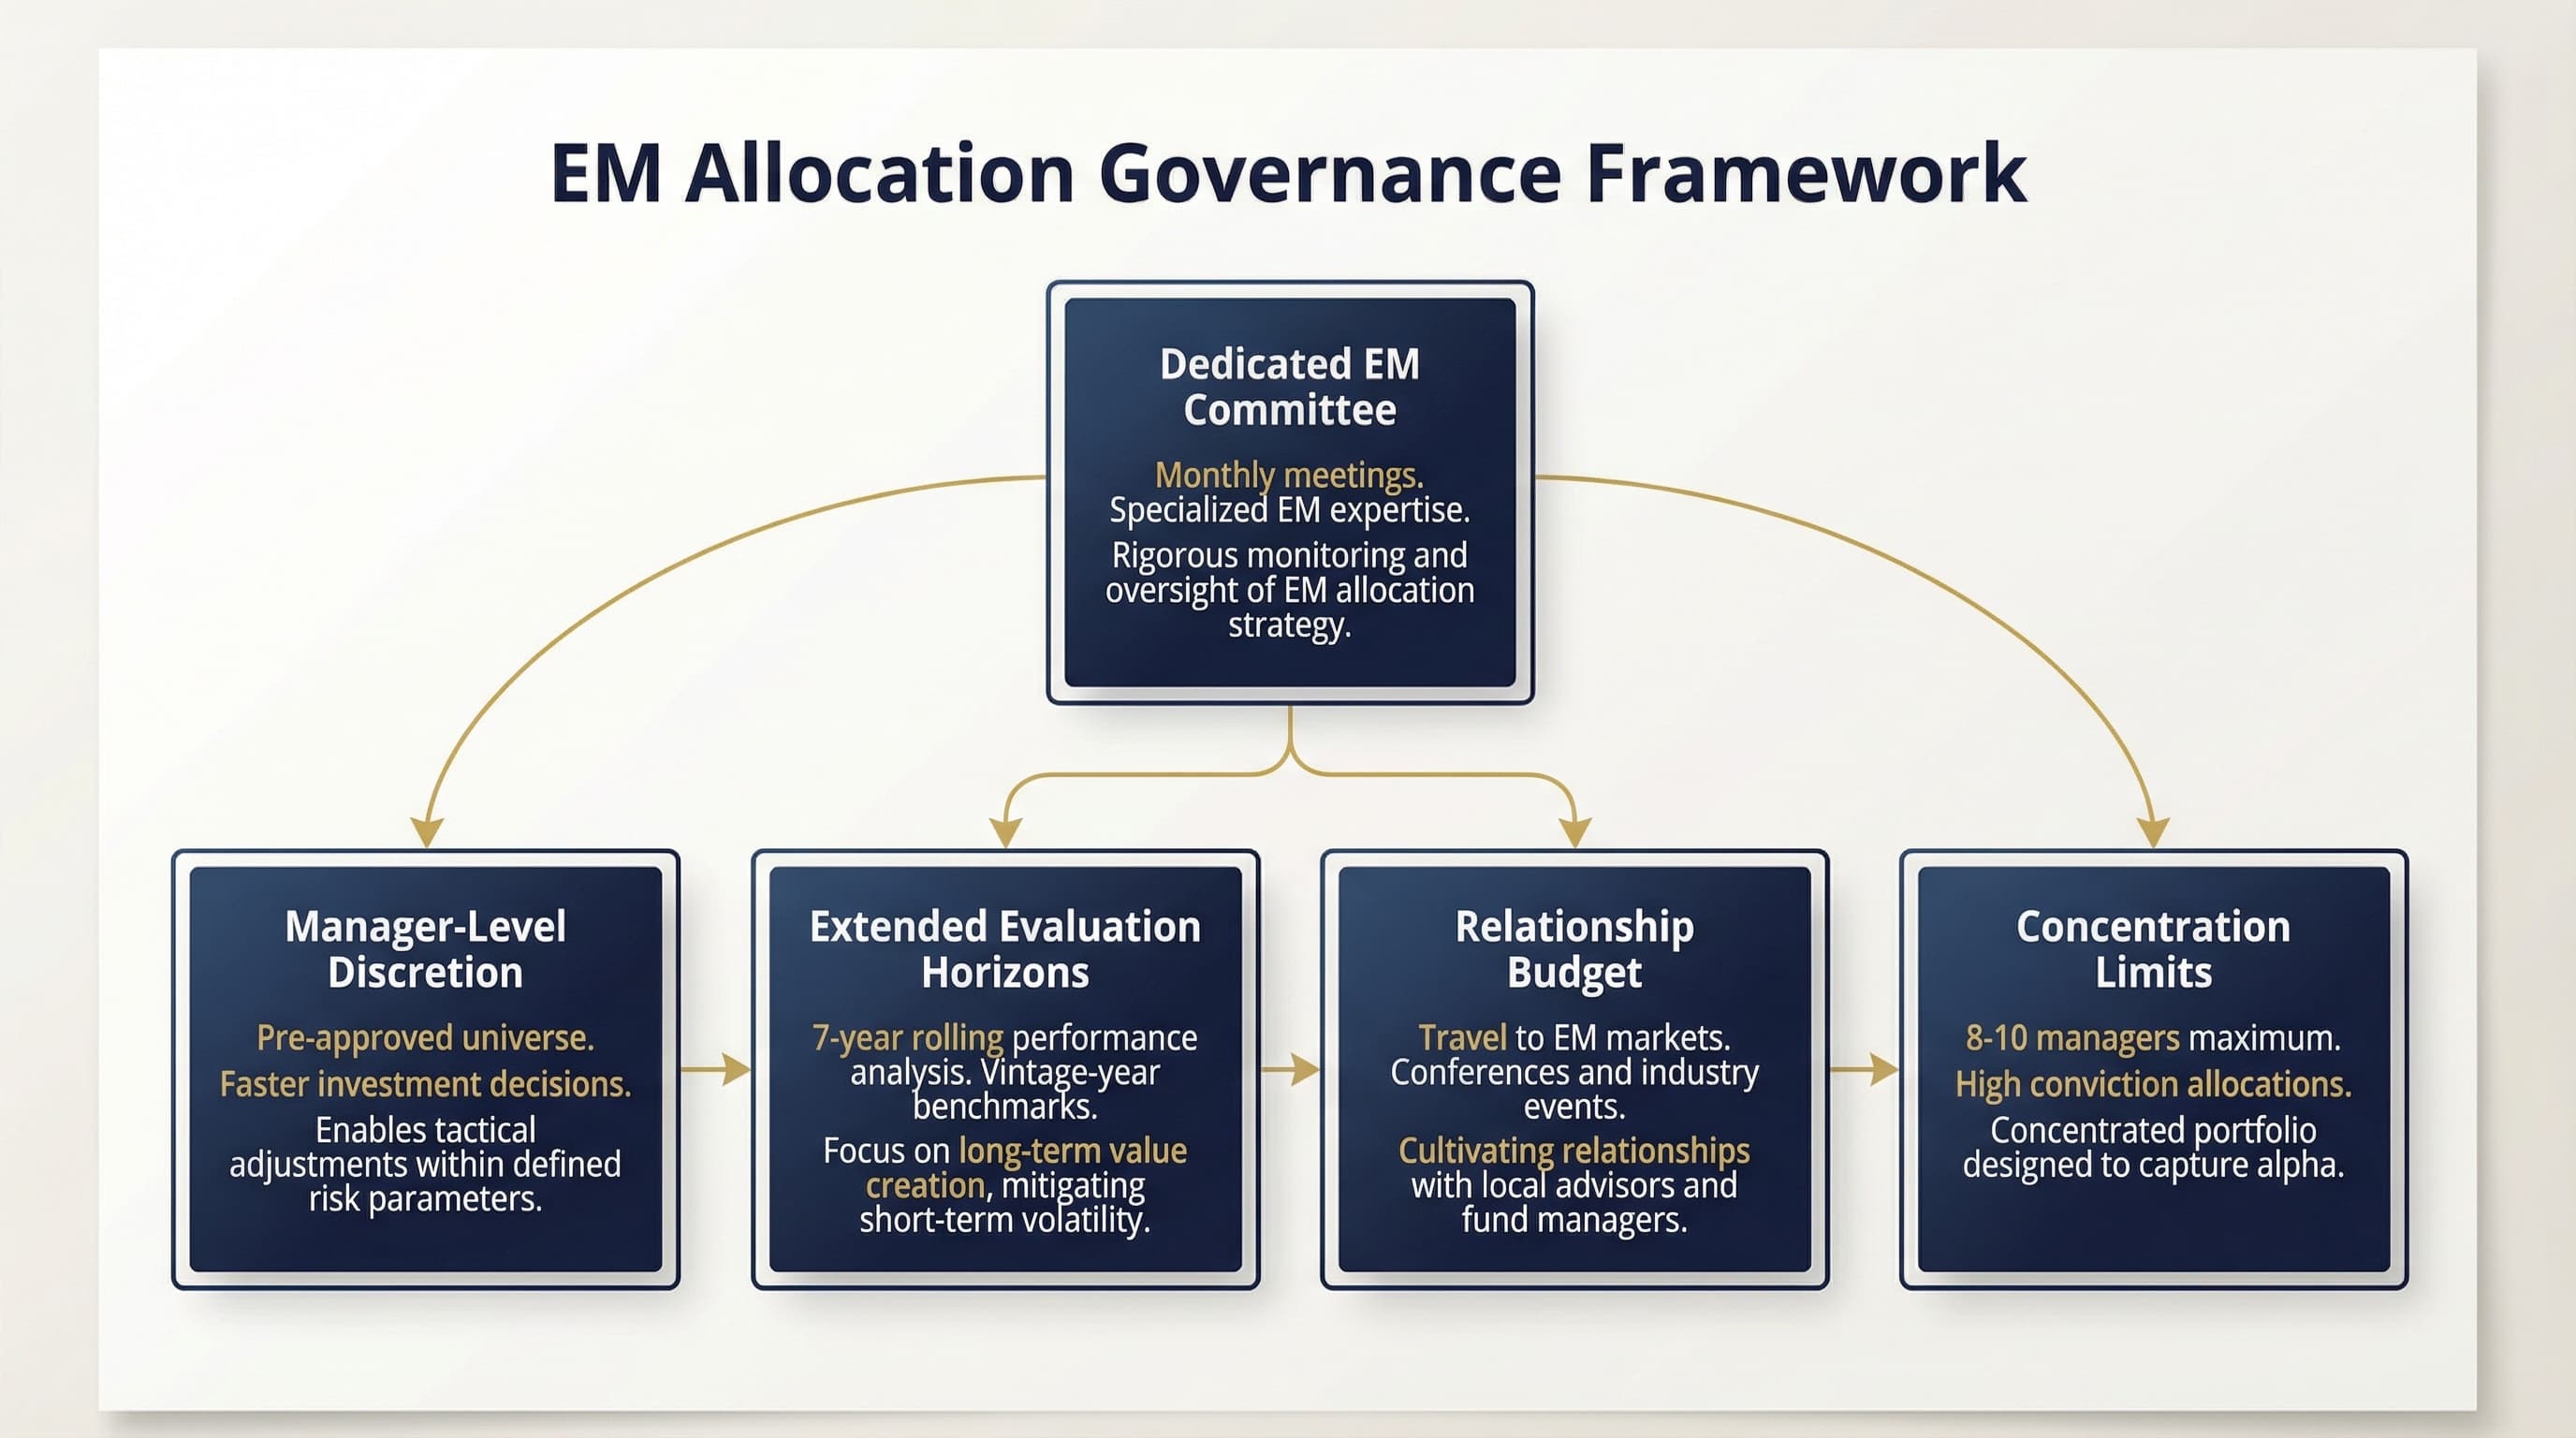
Dedicated EM Committee: A subset of the investment committee with specific EM expertise, empowered to approve managers within approved strategy parameters. This committee should meet more frequently than the main IC (monthly rather than quarterly) with shorter but more focused agendas.
Manager-Level Discretion: Pre-approve a universe of potential EM managers based on qualitative assessment. Allow investment staff to commit to managers within this universe without requiring full IC approval for each commitment. This enables faster decision-making without sacrificing governance.
Extended Evaluation Horizons: Evaluate EM managers on a 7-year rolling basis, not annually. Accept that vintage-year comparisons are the only meaningful benchmark. Report to the board on program-level returns, not individual manager interim valuations.
Relationship Budget: Allocate specific resources (travel budget, conference attendance, local advisor relationships) for maintaining EM market presence. This is not an expense; it is an investment in deal flow and information advantage.
Concentration Limits: Accept higher concentration in EM than in developed market PE. A portfolio of 8-10 exceptional EM managers will outperform a portfolio of 25 mediocre ones, even though the latter looks more "diversified" on paper.
Conclusion: The Choice Before LPs
Emerging markets are not difficult to invest in. They are difficult to invest in well. The LPs who succeed are not smarter or luckier than those who fail. They simply have governance structures, time horizons, and evaluation frameworks that match the asset class they are accessing.
The conventional approach, running EM through standard PE allocation processes with standard due diligence and standard time horizons, reliably generates below-median returns. The data is unambiguous. The dispersion is too wide for generic approaches to work.
The alternative requires institutional change: dedicated resources, specialized governance, longer time horizons, and acceptance of smaller absolute allocations with higher conviction. Most institutions are unwilling to make these changes. That reluctance is precisely what creates the opportunity for those who do.
For LPs willing to invest in building EM capability rather than just allocating EM capital, the returns are available. Not from "emerging market beta" or broad exposure to EM indices, but from the patient, relationship-driven, high-conviction approach that captures the 2,200 basis point spread between top and bottom quartile managers.
The question is not whether emerging markets offer attractive returns. The question is whether your institution is structured to capture them.
For perspective on specific emerging market opportunities, see our analysis of West African real estate fundamentals or our guide to understanding Gulf investors as LP capital sources.
If you are reconsidering your institutional approach to EM allocation, contact us for a candid conversation about what would need to change.
Sources & References:
- Cambridge Associates (2024). "Emerging Markets Private Equity & Venture Capital Benchmark"
- McKinsey & Company (2025). "Global Private Markets Report 2025"
- Harvard Kennedy School (2025). "An Empirical Analysis of Investment Return Dispersion in Emerging Market Private Equity"
- Coller Capital (2025). "Global Private Capital Barometer, Summer 2025"
- World Bank (2025). "Long-Run Returns to Private Equity in Emerging Markets"
- AVCA (2024). "African Private Capital Activity Report"
- Goldman Sachs Asset Management (2025). "Private Markets Diagnostic Survey"
- Citi Private Bank (2025). "Global Family Office Report"
- PwC (2025). "Global Family Office Deals Study"
- OECD (2025). "Pension Markets in Focus"